
Tasks Gantt View
Gantt is one of the available views in the Tasks module. It presents all tasks in the form of a timeline chart.
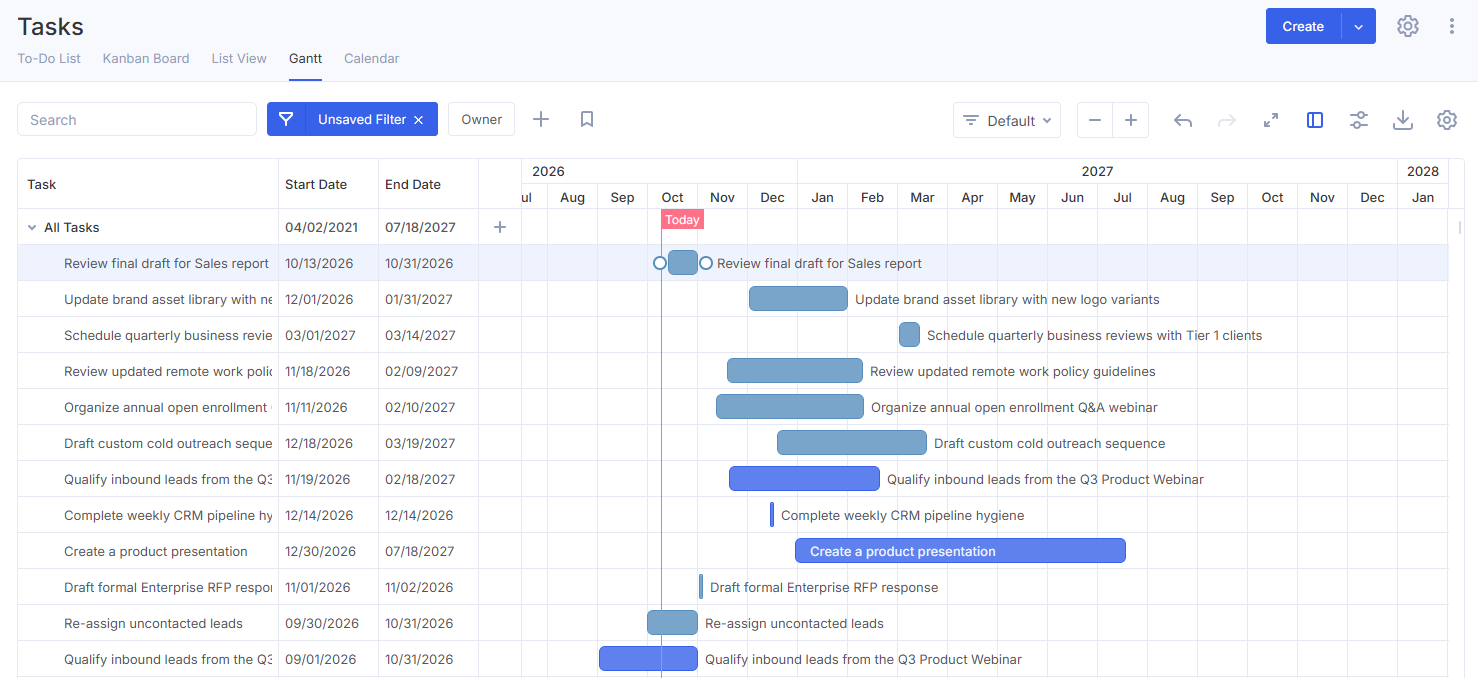
This task view helps you:
- Visually plan task deadlines
- Track progress on tasks across all projects simultaneously
- Evaluate workload by employee and by project
Structure of the Task Gantt Chart
Gantt chart consists of two parts: a data table with a task list (1) and an interactive chart (2).
At the top of the chart, there is a timeline along which tasks move.
Because all active tasks will be displayed on the Gantt chart upon your first visit, use the filters located above the chart.
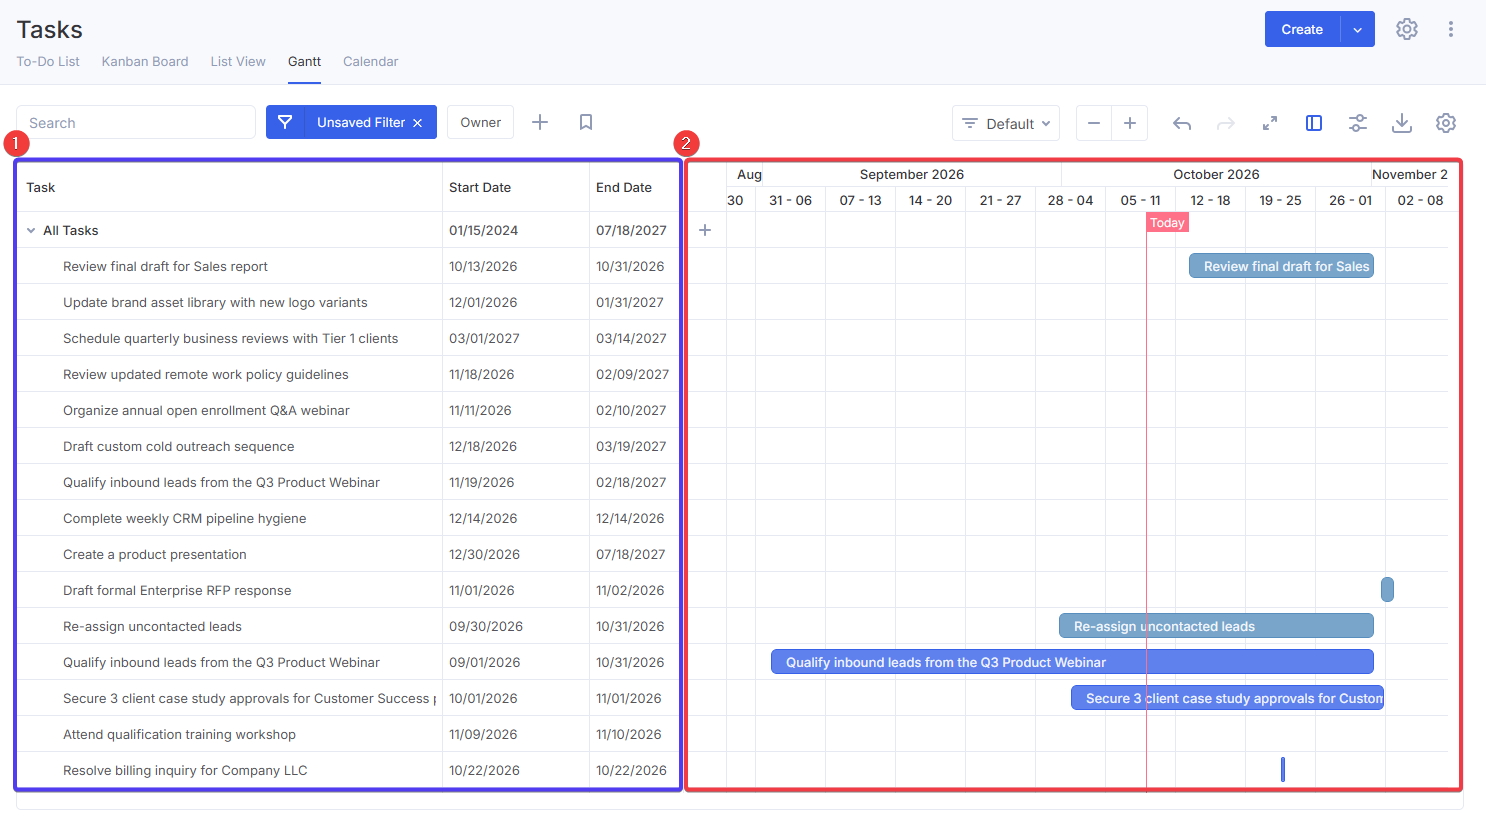
Chart Display Settings
Display settings are located at the top of the chart. They allow you to:
- Sort tasks
- Change the chart scale
- Hide the data table
- Group data
You can also:
- Export the chart in spreadsheet format (XLSX)
- Open chart view settings
View Settings
View settings can be accessed via the gear icon.
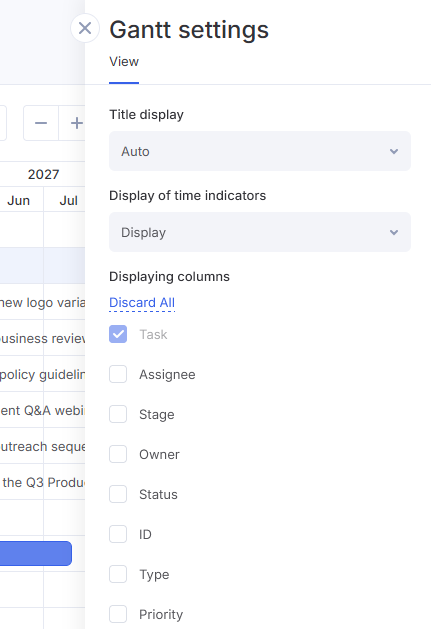
In these settings, you can:
- Toggle the display of task names on the chart
- Select which columns to show in the data table
Sorting
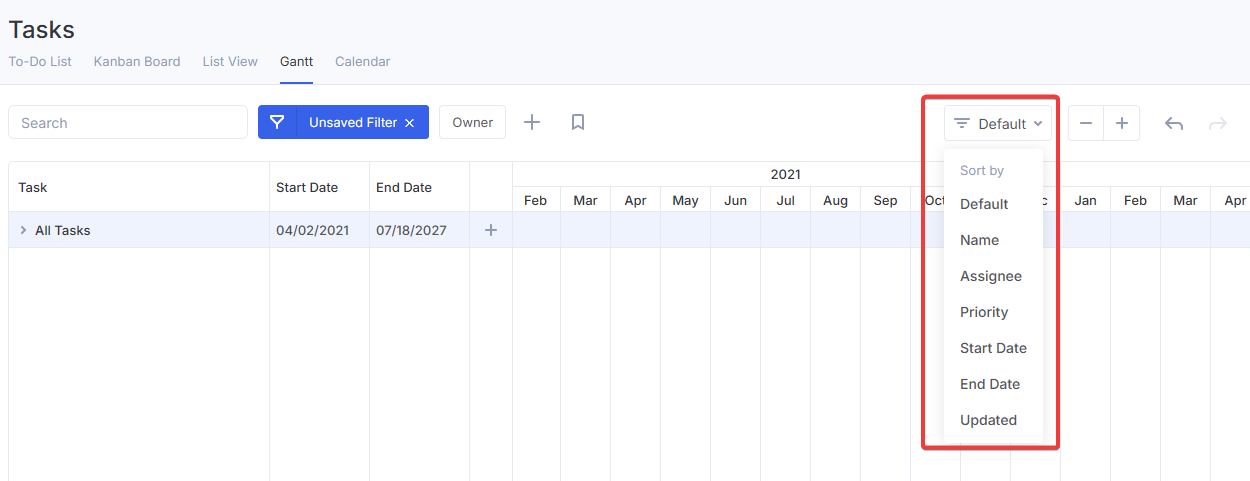
Using the dedicated dropdown menu, you can set how tasks are sorted in the data table (and consequently on the chart itself):
- Alphabetically
- By assignee
- By priority
- By start date
- By deadline
- Last modified date
Scaling
Chart scaling allows you to adjust your planning granularity, from months down to hours. You can switch scales using the corresponding buttons.

You can also zoom the chart using hotkeys by scrolling the mouse wheel while holding Ctrl on your keyboard.
Grouping
Grouping settings divide the data table into task clusters.
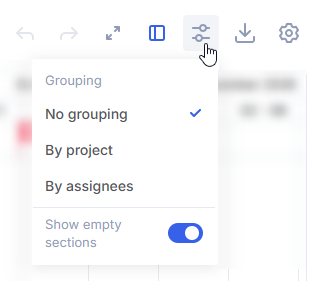
Two grouping options are available:
- By Project: functions as a standard Gantt chart, helping you track current project progress.
- By Assignee: helps you evaluate the current workload across team members.
Managing Tasks on the Timeline
Adjusting Dates & Duration
To change task dates (e.g., reschedule to a later period), simply click the task bar and drag it along the timeline.
To change task duration, hover over the task bar, click the resizer handle, and stretch or shrink it along the timeline.
Task Management Menu
To access additional task settings, hover over a task in the data table and click the context menu icon.
From this menu, you can:
- Edit a task
- Create a subtask
- Open the new task creation form
- Change the assignee
- Open task details page in a new browser tab
- Copy link to a task
- Create a copy of a task
- Archive tasks
- Delete tasks
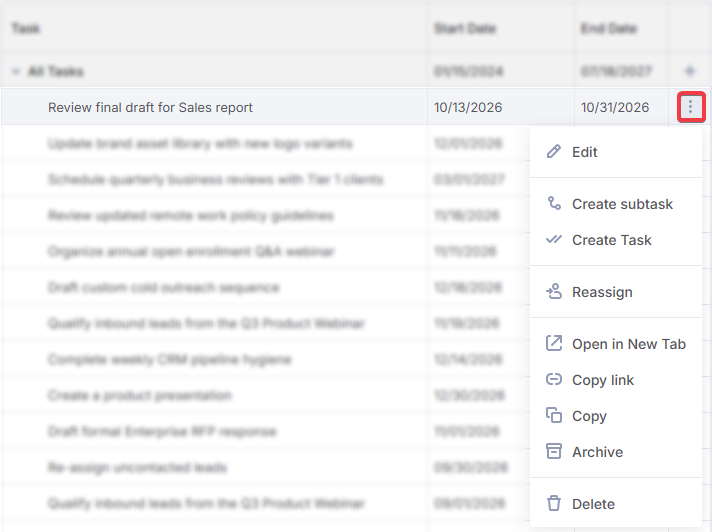
The menu allows you to manage and update tasks without needing to navigate to the task details page.
Editing Tasks on the Timeline
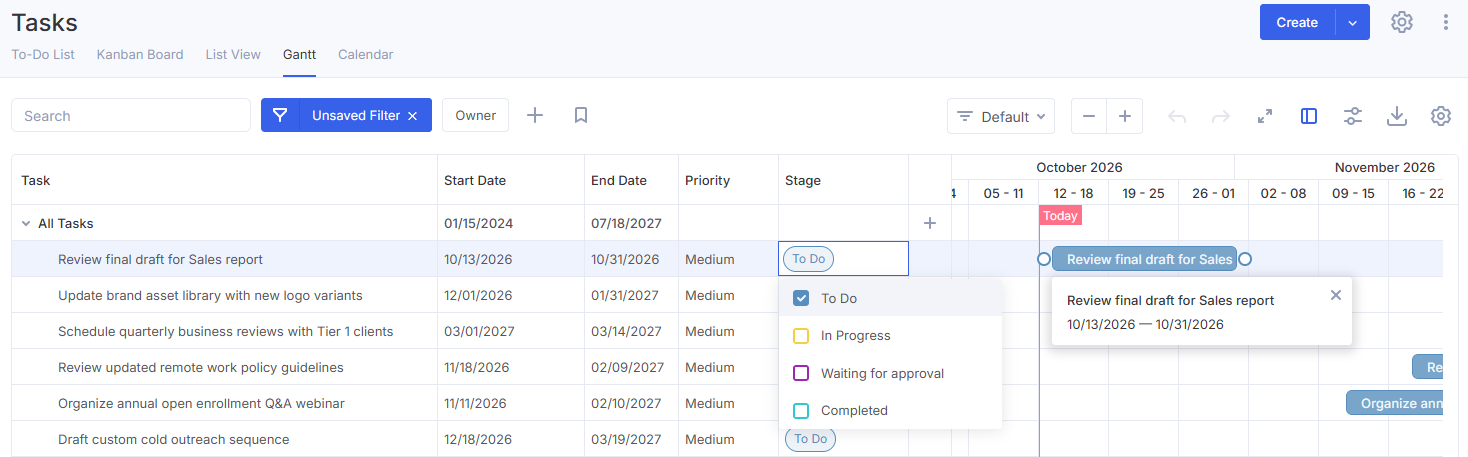
You can edit any task directly on the timeline, there's no need to switch to another tab.
To make changes, hover over a task in the data table on the left side of the screen and click the field you want to modify. The editable task properties depend on the columns currently displayed in the data table. This allows you to quickly update the task name, assignee, status/stage, dates, and other attributes.
Task Dependencies
You can link tasks together on the chart when one task cannot start or finish until another is completed.
There are five dependency types available:
- Start-to-Start — A task starts right after the previous task begins;
- Start-to-End — The following task ends no earlier than the previous task starts;
- End-to-Start — The following task starts only after the previous task is completed;
- End-to-End — The following task finishes no earlier than the previous task is completed;
- Relates to — Tasks are linked, but their dates do not affect each other.
To create a dependency, hover over a task bar to reveal nodes at both ends. Left node represents the start, and the right node represents the end. Click and hold the left mouse button on a node, then drag a line to a node on another task.
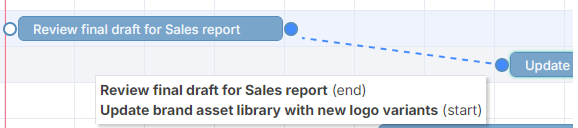
Note: The dependency type depends on which nodes you connect (e.g., connecting an end node to a start node creates an End-to-Start dependency, connecting a start node to a start node creates a Start-to-Start dependency, and so on)
Dependencies can also be added directly inside a task card: go to Dependencies section and select Add Dependency.
Relates to dependency can only be created this way and is not displayed on the chart
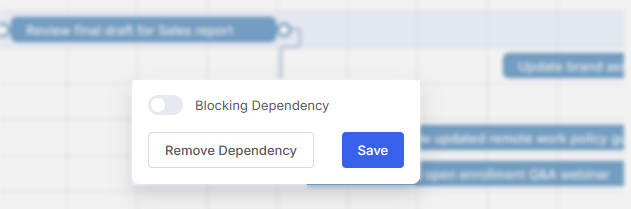
To remove a dependency, click on the dependency line on the chart and select Remove Dependency.