Gantt Chart
A Gantt chart is a popular tool in project management, aimed at showing task or any other activity performance against time. On the chart, you can see multiple bars representing different tasks. Each bar shows the start and end dates of a task or any other activity. In Flowlu's Agile module, a Gantt chart represents sprints or epics. Let's have a closer look at how it works.
How to Use the Gannt Chart in the Agile Module
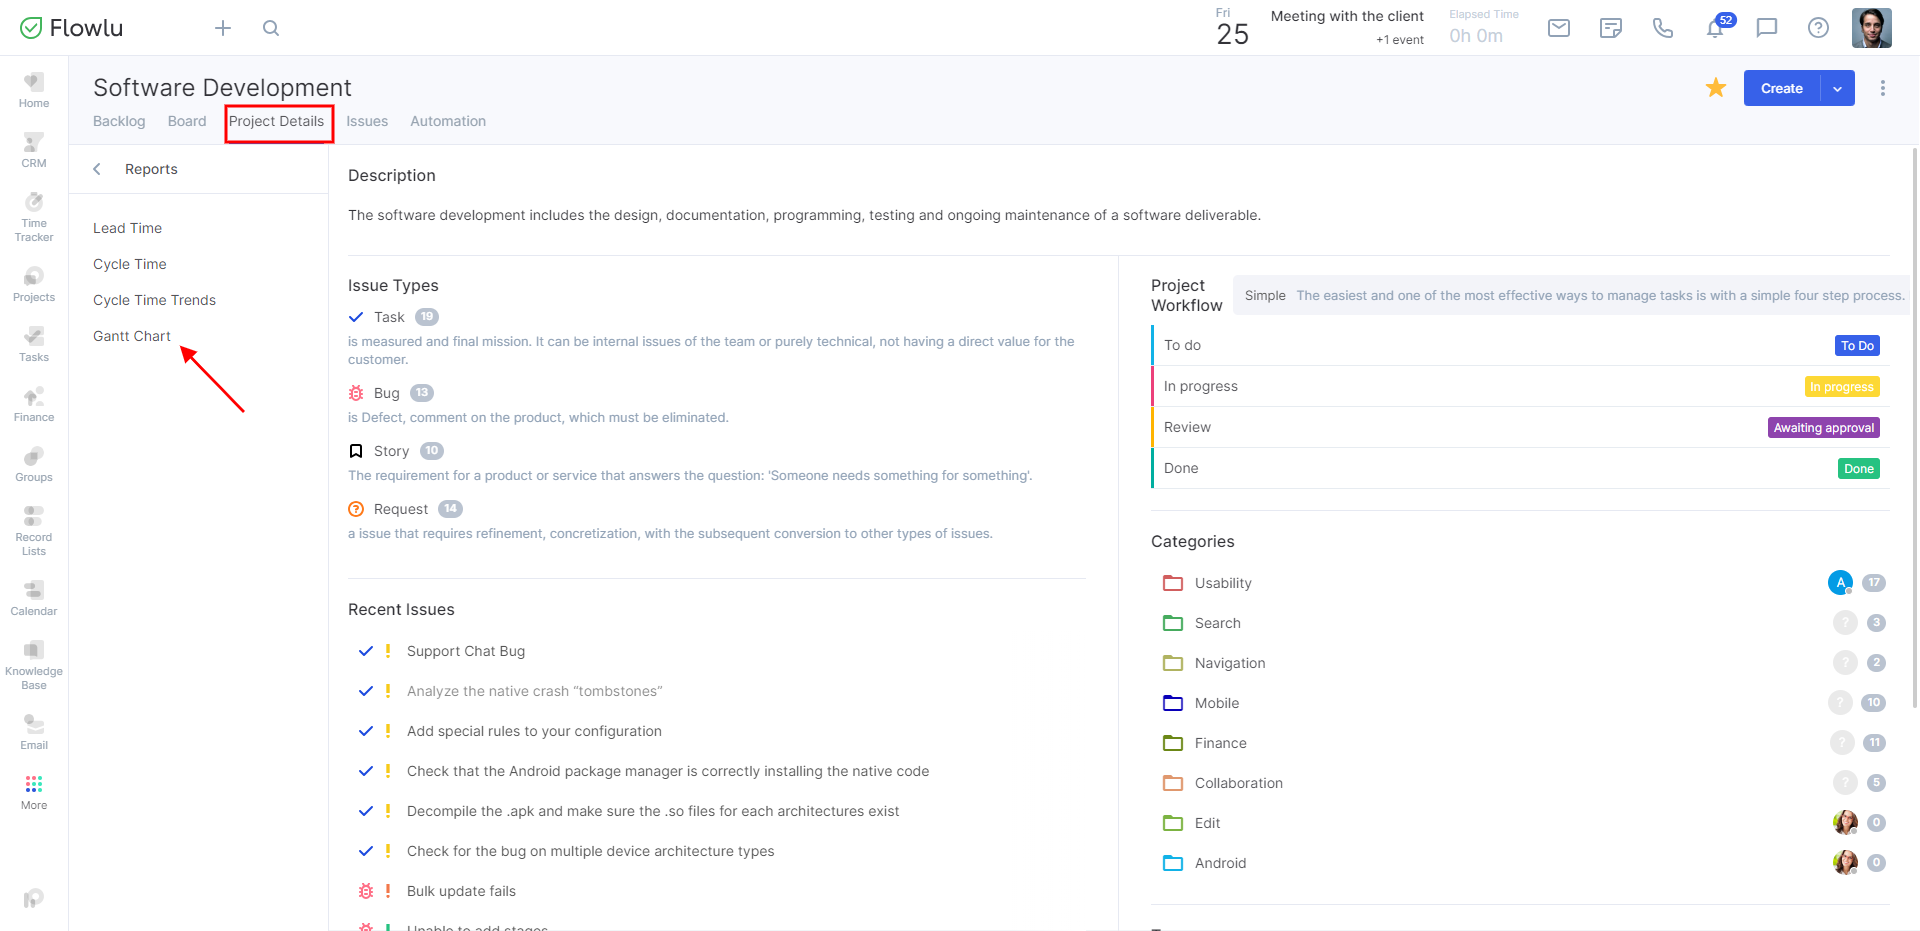
A Gantt chart is available for all Agile projects in Flowlu. To open it, go to the Agile module and open the project you need to analyze.
Go to Project Details → Reports → Gantt Chart.
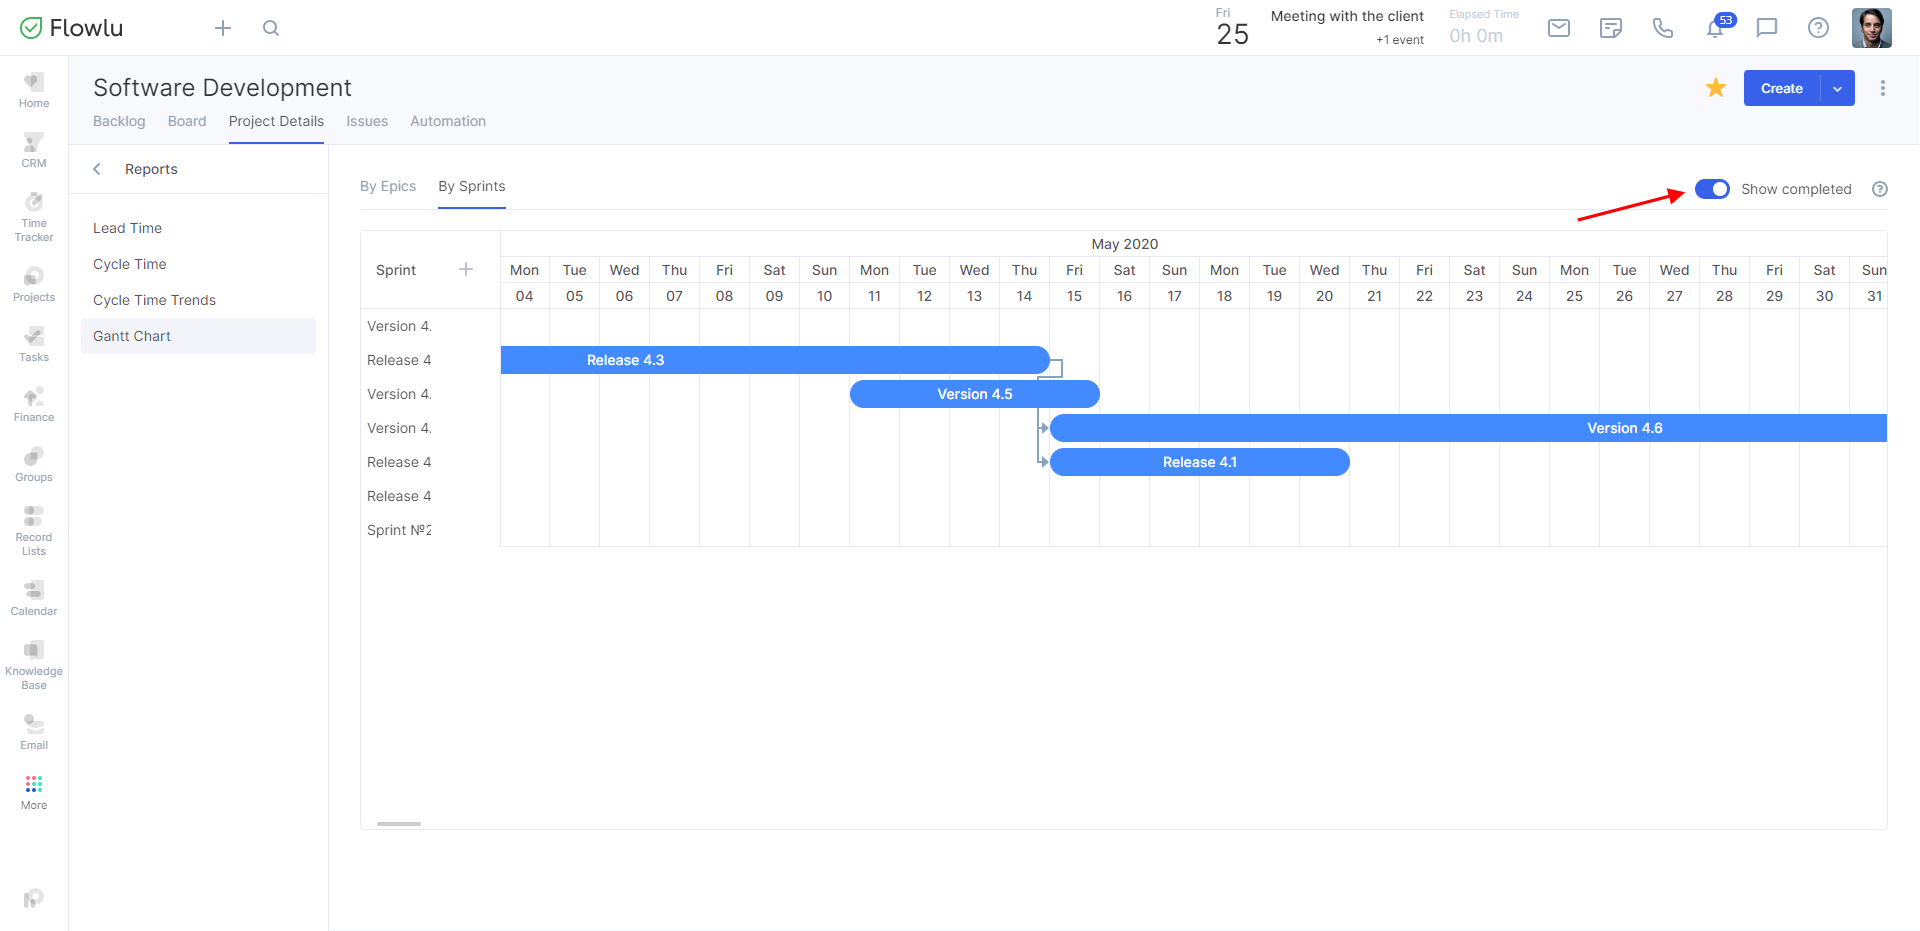
In the opened window, you'll see the Gantt chart report for you Agile project.
You can build two types of the report:
- By spints
- By epics
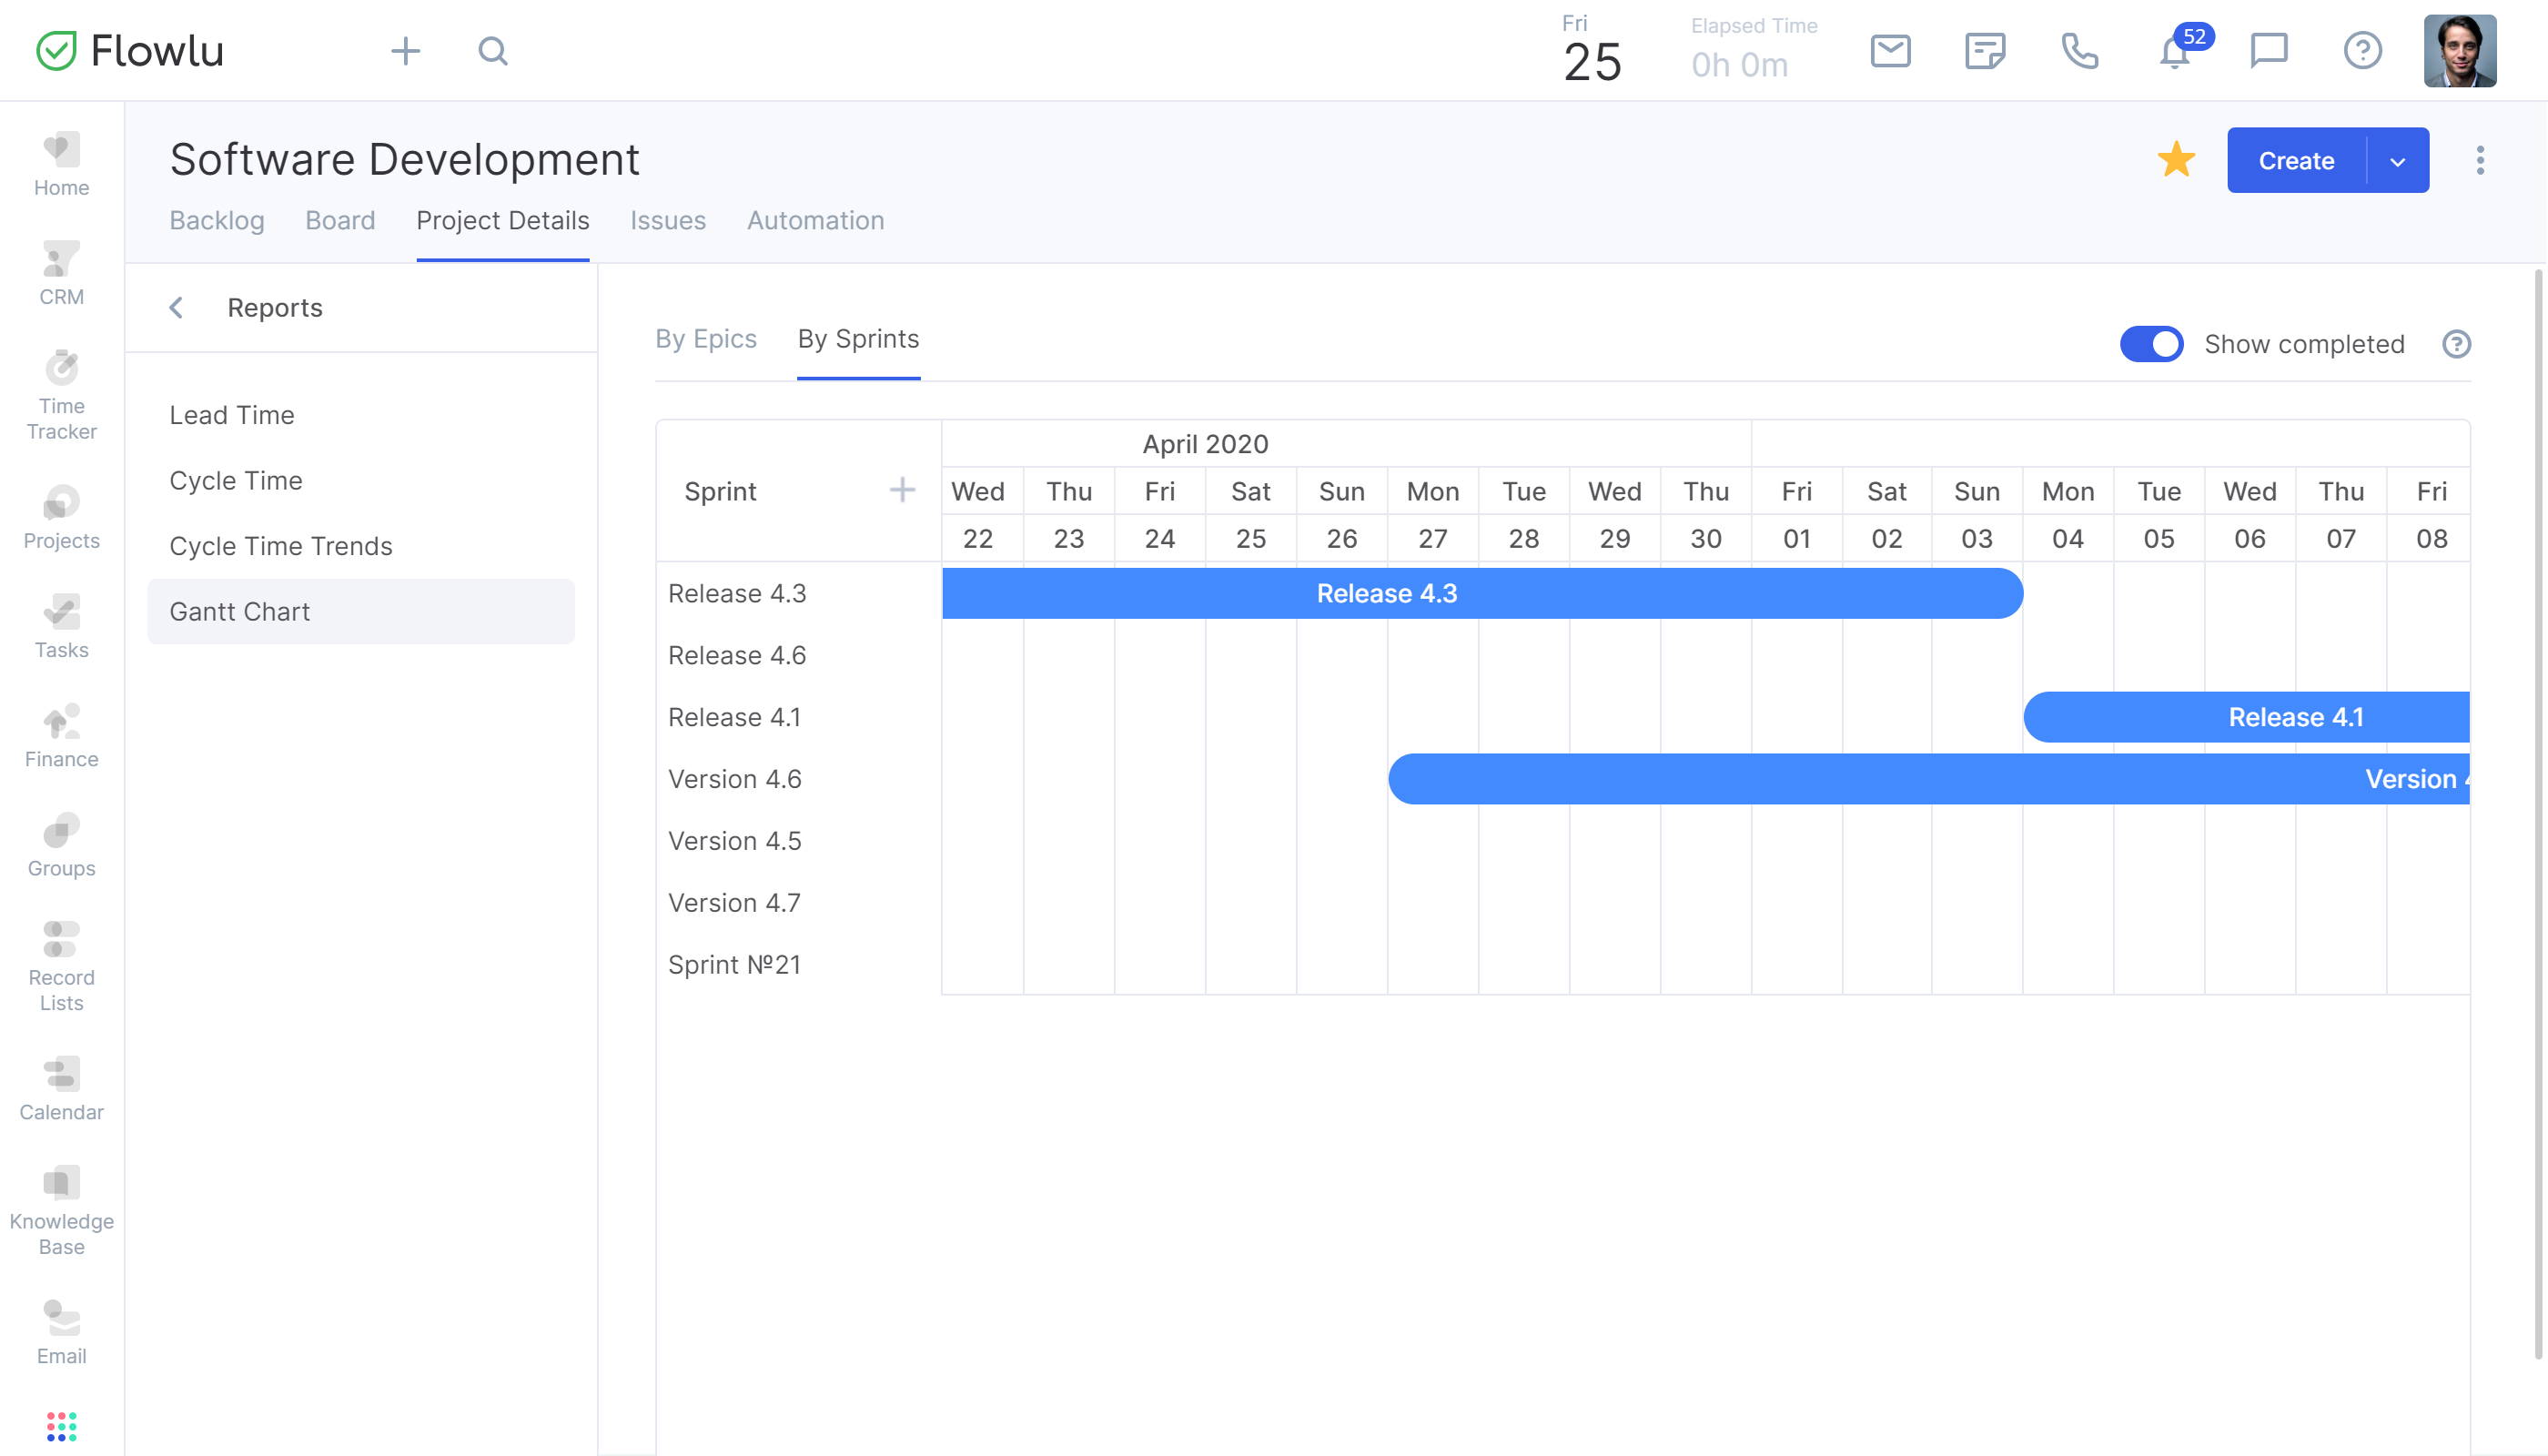
In the left menu, you can see the full list of sprints or epics related to this project. By clicking the "+" button, you can add a new sprint or epic to the list.

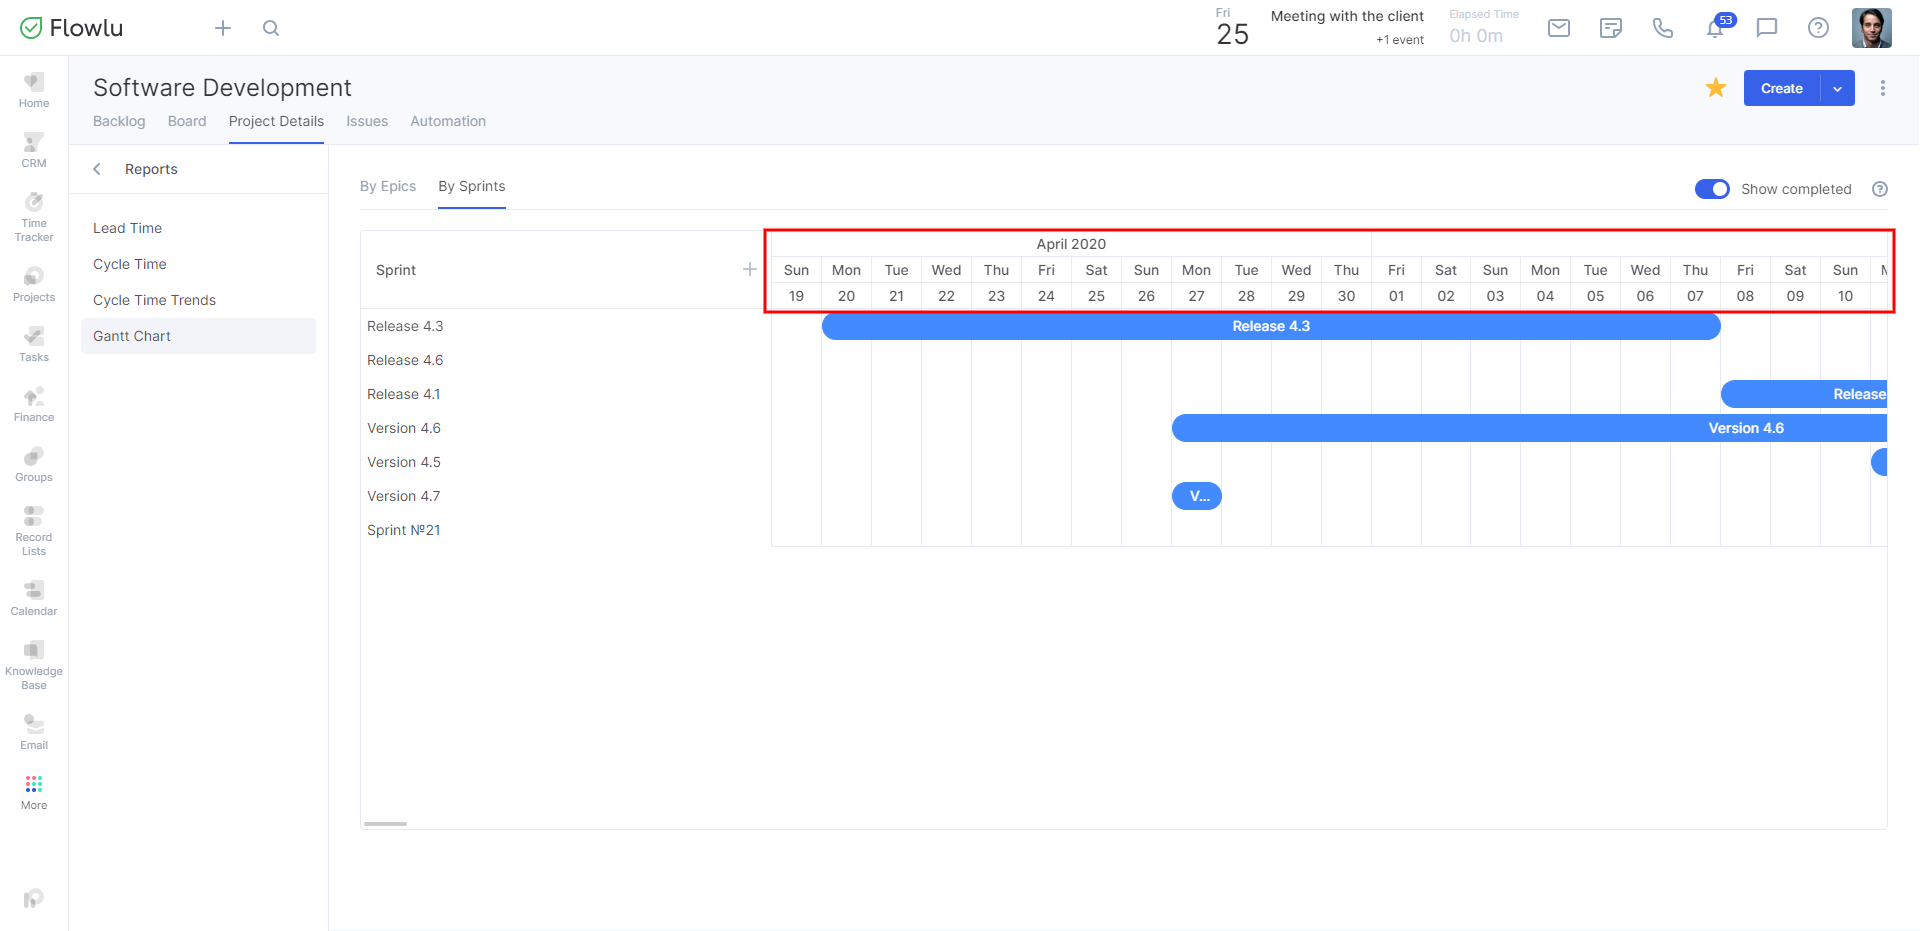
On the upper bar, you can see the timeline. The timeline depends on start and end dates of all sprints and epics in the project. To change the scale, hover over the chart and scroll up or down to expand or diminish the date range.
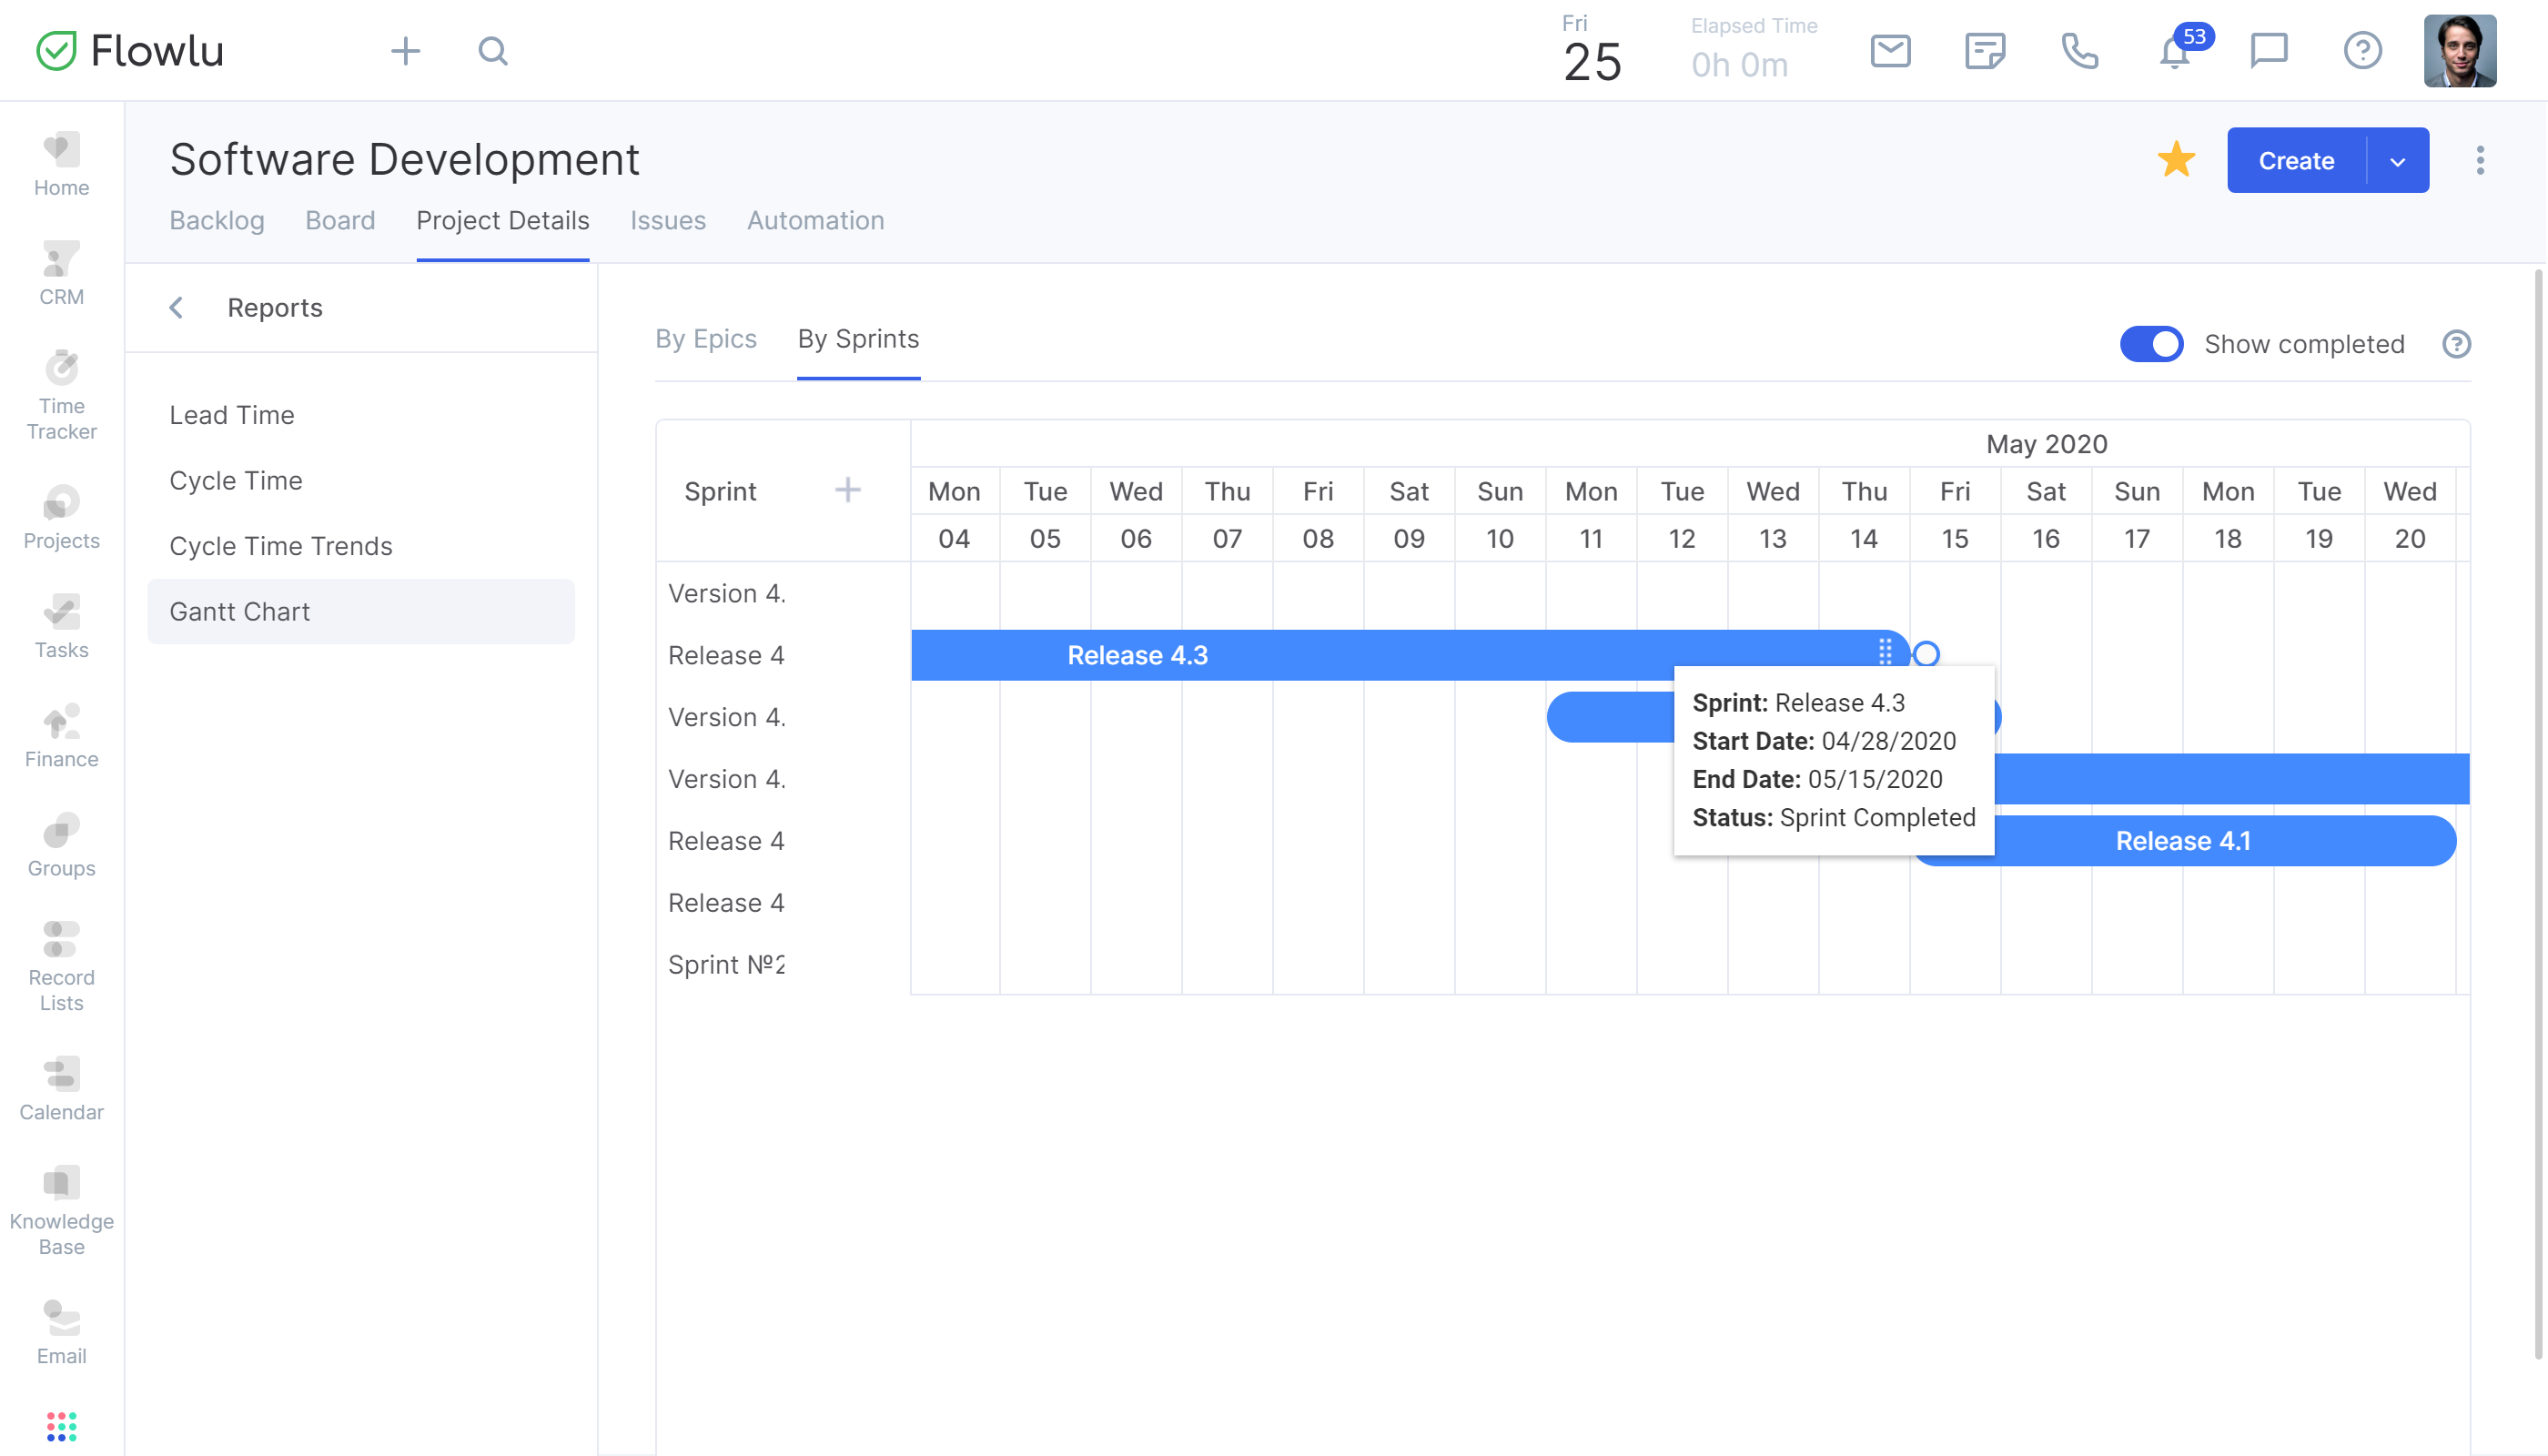
You can interact with the bars on the chart. For example, change the duration of sprints and epics by dragging the bar, or set relations between sprints and epics by holding a small circle next to the bar.
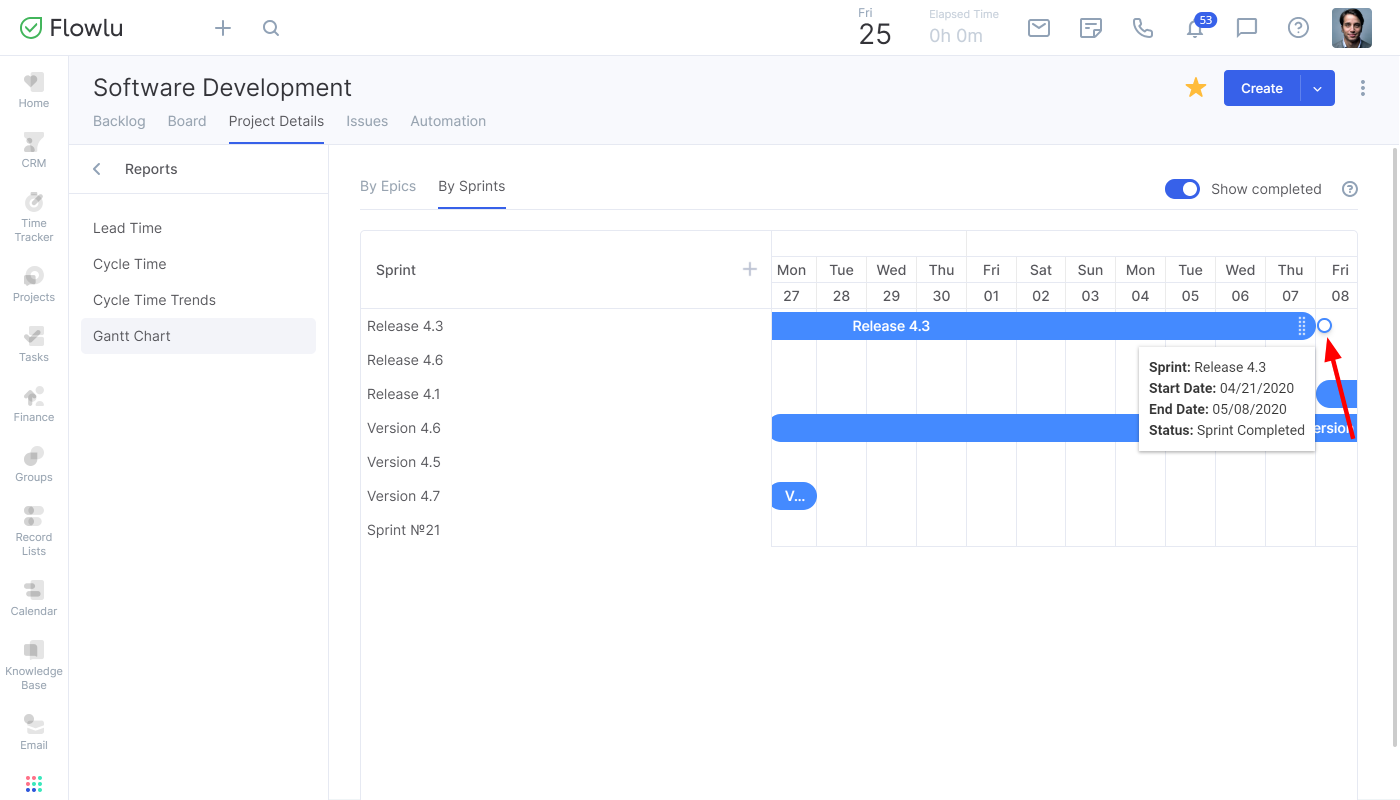
To see detailed information about a sprint or epic, hover over its bar on the chart. You can see detailed information about the sprint, its start and end dates, and also check its status.
If you want to see all sprints or epics, both started and completed, enable the Show Completed option on the slider.