


What Is a Gantt Chart, and How Does It Work?

- Gantt Chart Definition: What It Means in Project Management
- Why Use a Gantt Chart? Key Reasons and Use Cases
- 10 Essential Components of a Gantt Chart
- How to Use a Gantt Chart in Project Management
- How to Create a Gantt Chart: 5 Easy Steps
- Top 12 Benefits of Gantt Charts
- 9 Drawbacks of Gantt Charts You Should Know
- When You Should (And Shouldn’t) Use Gantt Charts
- Are Gantt Charts Right for You? Key Takeaways

For more than a century, the Gantt chart has been used around the world for project management. This handy work schedule was created by Henry Gantt back in 1910 to visualize task stages and deadlines. But can a tool like this still stay relevant after so many years? Let’s find out!
Gantt Chart Definition: What It Means in Project Management
Simply put, a Gantt chart is a visual project management tool that provides you with a clear timeline of your projects. You can see all tasks in detail to ensure that there aren’t handoff misses, slipped deadlines, or anything that prevents the work plan from being completed successfully.
Ultimately, a Gantt chart shows you the project schedule and the steps that need to be completed in order, as well as their duration, when they’re due, and other important details you may want to include.
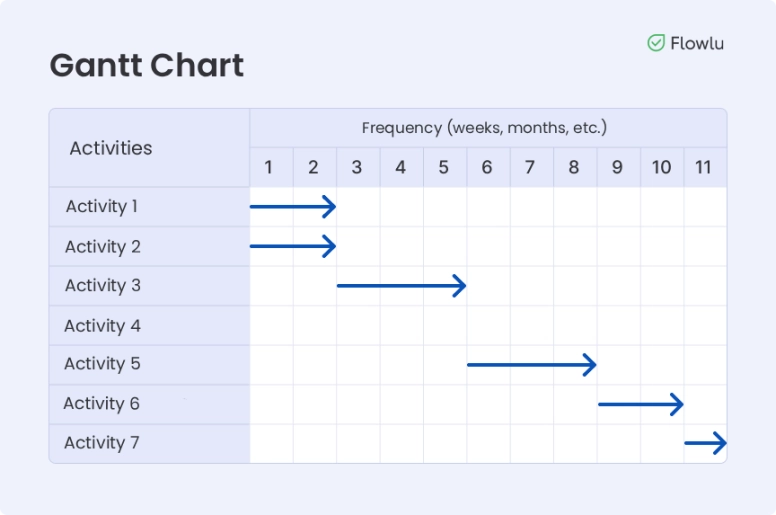
As we said above, Gantt charts are a visual tool (a horizontal bar chart) that includes two different parts: on the left side you have a task list or grid, and on the right side you have the project timeline. When creating this kind of chart, you can include many elements such as:
- The task name
- Work breakdown structure
- The due date
- Planned resource costs
- Planned hours
- Task dependencies
- And other details
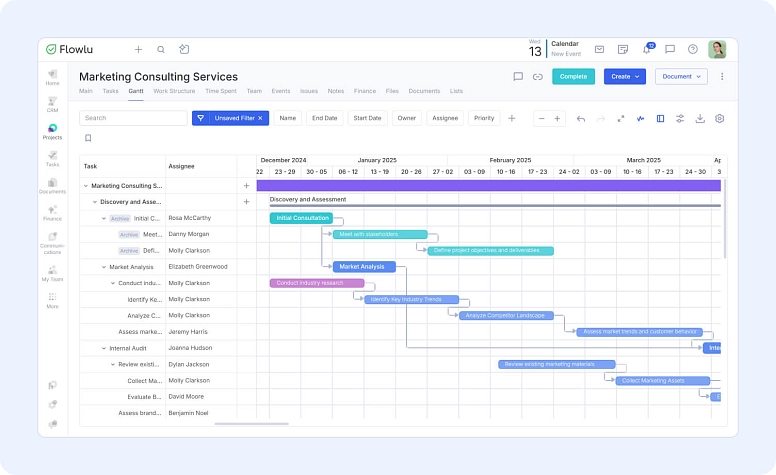
You can draw a Gantt chart on paper, but it’s much more effective to use dedicated tools and online builders. They make it easy to update the chart, keep everything transparent for the team, and track the project in real time.
For example, Flowlu automatically creates a timeline based on the tasks you add. All you need to do is plan the steps, assign responsible team members, set deadlines, and define dependencies. And if something goes off track, you can adjust the deadline — Flowlu will automatically shift the connected stages and show the updated sequence of actions.
Why Use a Gantt Chart? Key Reasons and Use Cases
Most people think of Gantt charts as a useful tool for PMs to keep track of all the tasks in a visual way. However, they are a lot more than that. In fact, they can also be used for a wide range of things, including resource management, work plan tracking, project planning, and even scheduling. They can also be used for managing or even improving an internal business process.
Gantt charts are most commonly associated with initiatives that follow the waterfall methodology. Waterfall is known for being one of the most structured approaches because every phase depends on the one before it. If one task falls behind, the next team or department can’t begin their part.
This linear flow is exactly what a Gantt chart captures so well. The project is laid out as segments along a timeline. Each segment marks the start and end dates of a task, and its length shows how long the task will take. In most traditional waterfall setups, these segments do not overlap. When placed together, they outline the full duration of the entire initiative.
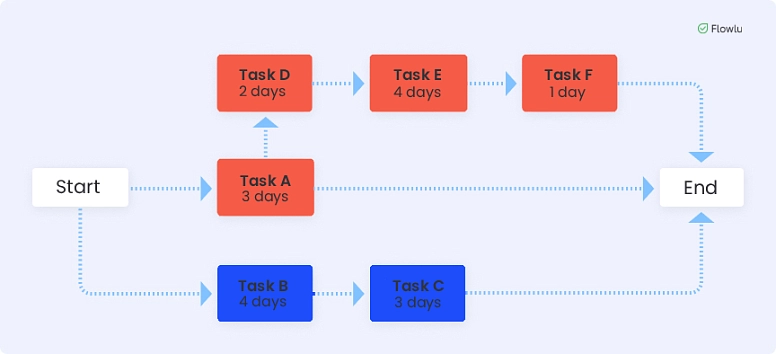
Compared to a network diagram, a Gantt chart has its limitations. It focuses on a linear sequence of steps from the start of a project to its completion. A network diagram, such as the one used in the critical path method, shows the work plan as a more complex web of operations, including unrelated or secondary tasks.
Because a Gantt chart represents a linear order of steps, it is most often used for:
- preparing complex initiatives with many sequential operations;
- tracking links between activities: the plan helps establish a clear order of actions so that no task begins before the previous one is finished;
- making adjustments during the project. This is possible thanks to milestone tracking.
A Gantt chart helps a manager determine:
- what stage the project is currently in;
- who is responsible for each stage;
- where delays are happening;
- how tasks are connected;
- what sequence of work must be followed;
- how many resources are assigned to each stage.
As a result, the chart allows you to create reports based on clear, visual data that reflect the current state of the initiative.
3 Ways Teams Use Gantt Charts
1. Planning a marketing campaign
Large campaigns usually require close coordination between several departments: designers, marketers, advertising specialists, and PR teams. The chart helps establish a chain of related activities so that nothing important is missed.
2. Launching a new product
The chart typically begins with concept development and ends with the product launch. The schedule system works especially well in companies that release new products regularly. Managers know from experience how long operations take, in what order they should be completed, and who is responsible for each stage.
3. Visualizing project progress for a client
A customer or investor doesn’t want to dig into internal details — they need a quick way to understand timelines, key stages, and critical milestones. A Gantt chart is perfect for that. It helps present the project before it begins and report on its progress tracking at every stage.
10 Essential Components of a Gantt Chart
As we already mentioned above, a Gantt chart can include many elements. The most important ones include:
#1: Task List
As you can tell by its name, you can see all the tasks broken down into activities, phases, and deliverables. It is represented on the vertical axis of the chart and requires choosing a single unit of measurement for all subtasks: a day, a week, or a month.
#2: Timeline
This shows the project (and all its components, such as the tasks) from the start date until the end date. Timeline is represented on the horizontal axis of the chart.
#3: Duration
This shows the time a task will take, represented in the bar. The duration helps project managers create a more manageable and realistic project schedule.
#4: Resources
This shows all the tools and team members that are assigned to each task. From here, it’s a lot easier to see who is responsible for a task, as well as what is still missing to complete it. It is a great tool for resource allocation that can be used for stakeholder reporting.
#5: Dependencies
In a project, there are always activities that can only be done when another task is complete. By knowing sequencing, the PM can easily keep the workflow organized and everyone working. On the simplest schedule charts, dependencies are built linearly: each task depends on the one before it. But in reality, the relationships between tasks can take three forms:
- Task C cannot start until task B has been started.
- Task C cannot start until task B has been completed.
- Task C cannot start until another task A has been completed.
#6: Milestones
Milestones can be anything from deliverables, meetings, and deadlines to key approvals. These are important checkpoints that need to be included in a Gantt chart.
#7: Today Line
One of the best things about a chart is that it is updated in real time. This means you can easily check how the project is going on any given day. This way, you’ll immediately know what is being done at this moment and what comes next.
#8: Progress
You can check the progress of each task by looking at the percentage of the task bar that is already filled.
#9: Critical Path:
This is an important element that your Gantt chart should always include. After all, critical path shows you the steps that are critical and that can affect your project deadline.
#10: Baseline
While this is a simple screenshot of your initial plan, it’s essential to compare it with the actual progress to ensure that you’re on the right track.
How to Use a Gantt Chart in Project Management
When you’re using a Gantt chart in project management, you’ll be ready to answer 3 questions:
- What are the tasks that need to be completed?
- When do these deliverables need to be completed?
- Who is responsible for the tasks?
One of the best things about schedule charts is that they are fully compatible with most project management methodologies, including Agile and Waterfall.
This tool is widely used in PM across several fields:
- construction
- IT
- e-commerce
- retail
- education
The Gantt chart is most effective in companies that require strict tracking of the order of operations and their deadlines. It works well for initiatives of any scale — from organizing personal activitites to planning the launch of a space rocket. Because of this, any number of people can work with the plan. The chart can be referenced at every stage of the process:
- planning and approving the plan
- monitoring progress by managers and self-monitoring by team members
- preparing interim and final reports
- analyzing the results after the project is completed
#1: Using Gantt Charts With Agile Planning:
For Agile planning, you need to plan Agile sprints where teams not only plan but also do the work. There are meetings where the performance is reviewed and where the next sprint is planned.
It’s important to note that while Gantt charts aren’t typically used for sprints, they can be. You can also use them to get a clearer view of your entire project.
#2: Using Gantt Charts With Waterfall Planning:
When you’re using the Waterfall project management methodology, you’ll need to start by planning your work in phases that should then be executed in order. This is a perfect way to use visual charts since the PM will be able to easily see all task dependencies as well as their sequences on the timeline.
#3: Using Gantt Charts With CPM (Critical Path Method):
It’s essential to determine the critical path in some projects to ensure that you have all the resources that you need. As you can easily understand, Gantt charts are tailored for this. After all, they can show you the task relationships visually, which will help managers prioritize.

How to Create a Gantt Chart: 5 Easy Steps
No matter what software you use to create the chart, you’ll go through the same preparation stages. Define your goals and tasks, estimate the time required, and regularly monitor how well the plan is being followed.
Step 1: Set the deadlines
The first step is to create the coordinate system, where the horizontal line represents time. Decide which unit of measurement you’ll use: hours, days, weeks, or months. Most often, a calendar format is used, where one unit on the scale corresponds to one day. List all tasks and subtasks within the project and determine their deadlines.
Step 2: Place the tasks on the Gantt matrix
Represent each task as a horizontal bar. Add them to the chart based on their start and end dates. During this step, you can also assign responsible team members. This helps everyone immediately understand what they need to do and when. For better clarity, you can mark bars with different colors: green for marketing, blue for developers, and yellow for managers.
Step 3: Define task dependencies
Some steps can’t begin until others are completed. For example, product testing can’t start until development is finished. Identify all such links and mark them with arrows on the chart. This helps departments understand whom to follow up with, whom to request updates from, and improves communication within the company.
Step 4: Add milestones
Milestones are control points. If the project can be divided into significant phases, the boundaries of these phases become milestones. Meetings, client approvals, presentations of intermediate results, testing, and more can be organized around them. When one phase is completed, its effectiveness needs to be reviewed. Milestones also help determine which tasks are the highest priority.
Step 5: Keep the information up to date
It’s important not only to know how to create a Gantt chart but also how to use it. One of the key recommendations is regular data updates. This gives the team up-to-date information about the project and its tasks. You may need to update the chart when:
- new subtasks appear;
- the responsible person changes;
- deadlines shift;
- new revisions are added after approval;
- the final goal changes;
- resources are reduced or increased.
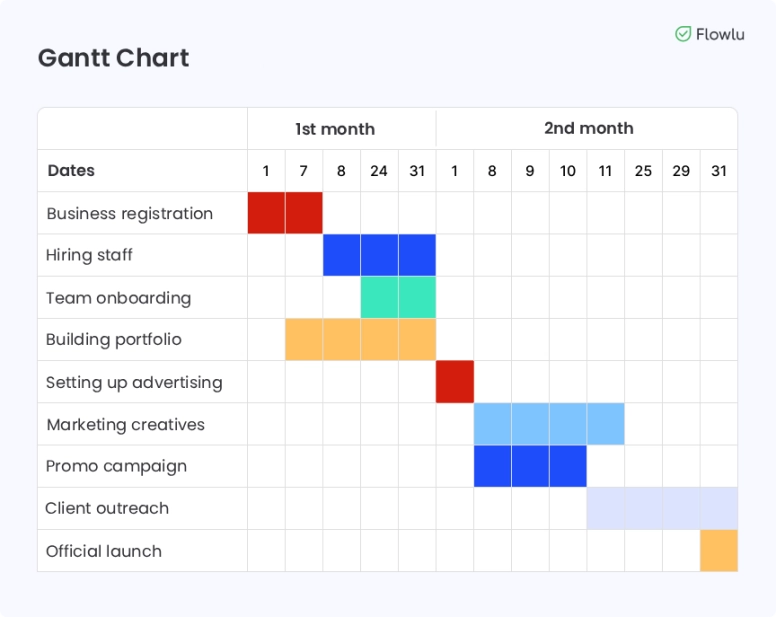
Let’s look at a Gantt chart example for the launch of a digital agency:
Top 12 Benefits of Gantt Charts
There’s no question that Gantt charts are one of the most essential tools for PM. Over time, this tool has proven its effectiveness — it has been used in manufacturing and sales for more than a hundred years.
The technology has also found its place in major projects run by global business giants. They are a great help not only for managing initiatives but also for planning, scheduling, and even keeping track of them.
Here are its most important advantages:
- They can turn a complex work plan into a simple timeline that is easy to understand.
- They are one of the best tools you can use to compare your performance with your original plan. You can compare the costs, the time, the budget, and others.
- They work well for both large initiatives and small goals.
- They can serve as a clear roadmap, making it easy to follow the progress of tasks as they happen.
- They are a great way for project managers to know how they are allocating their resources, especially time and people.
- Since you can see bottlenecks in real time, Gantt charts are often seen as a good risk management tool.
- Communication can be improved since everyone has access to the Gantt chart of the project and can easily understand it.
- They allow PMs to fully understand not only the scope of the project but also all task dependencies, including the critical path.
- They provide a clear view of how subtasks connect and depend on each other.
- They can be a great help for improving future projects since they provide a visual history of the timeline.
- They allow real-time tracking, which means that adjustments can be made quickly.
- They are widely supported in many project management tools and CRMs, making them easy to adopt across different industries.
9 Drawbacks of Gantt Charts You Should Know
But despite its popularity, the Gantt chart has its drawbacks and cannot be used in certain fields.
Here are the main disadvantages of Gantt charts:
- They aren’t very dynamic. And while they can be used for Agile projects, there are other tools that will probably work better.
- They require constant updates. Deadlines shift, requirements change, people leave, and unexpected issues appear — which means the chart often needs to be rebuilt almost from scratch.
- Not all software that uses Gantt charts offers the same features.
- Even though they are easy to understand, stakeholders and even team members need to learn how to use them properly.
- They shouldn’t be used for large projects since they may become very cluttered.
- They also shouldn’t be used for complex, highly detailed projects since they don’t capture everything you may need, including responsibilities, materials, equipment, or other important resources.
- They aren’t flexible. Everyone on the team has to work very tightly and follow the schedule strictly. If one part of the team is late, it can push the whole project back.
- They can be difficult to set up for large or branched projects with lots of parallel tasks, especially when task dependencies aren’t obvious.
- They’re not a good option for projects that need frequent changes, or for fields like IT and creative industries where flexibility and unpredictable timelines are more common.
When You Should (And Shouldn’t) Use Gantt Charts
As we already mentioned above, schedule charts are one of the best and most popular tools for project management. However, this doesn’t mean they should always be used for all initiatives. So, here are a few tips that tell you when you should and when you shouldn’t use them.
1. When to Use Gantt Charts
- Large projects that have sequencing and include multiple phases.
- Projects that require the collaboration of different teams or departments.
- When stakeholders want to get a clear view of the project deliverables and progress.
2. When Not To Use Gantt Charts
- When you have small and flexible projects, it is better to use Kanban boards instead of charts.
- Projects that require constant changes.
- Creative projects, since the process isn’t always linear; it’s more exploratory.
The opposite of strict waterfall planning and Gantt charts is the flexible Agile approach, which uses iterative cycles and supports ongoing changes through Scrum or Kanban boards.
The charts work well for projects with clear dependencies, set deadlines, defined subtasks, and assigned owners, while Kanban is better for scattered, parallel tasks that evolve as work progresses. Explore our guide to learn more about Gantt chart alternatives.
Are Gantt Charts Right for You? Key Takeaways
There’s no question that Gantt charts are one of the best project management tools. As a PM, you’ll find them very useful in most of your initiatives, especially when your project has clear deadlines and dependencies.
However, if your project needs a lot of changes along the way or is very complex, charts may not be the best tool to use. Flowlu gives you both options in one place — detailed Gantt planning and flexible Agile (Scrum) boards — so you can pick the approach that works best for each project. Give Flowlu a try for free and see which method fits your workflow.
It shows a lot of information, including what needs to be done, when the task will be completed, who will do it, the milestones, sequencing, and progress updates.
It is a very realistic, up-to-date, and clear project management tool. It gives you plenty of information at a glance while avoiding clutter.
While they are similar in terms of the information they provide, Kanban boards only show the tasks that are in the lists (to do, in progress, done). They miss an important part — links between deliverables and how activities relate to each other.
Yes, Flowlu includes built-in charts with sequencing, a critical path and progress tracking. The tool is flexible, visual, and easy to work with. It also supports auto-scheduling: dependent deliverables automatically adjust their timelines based on the predecessor’s schedule.
You can add a delay (lag) or an overlap (lead) between linked activities by clicking the dependency line and entering the number of hours or days. Gantt charts are available starting from the Essential plan at 12 dollars per seat per month.