


Best Gantt Chart Software in 2026: 12 Tools for Project Management


Gantt charts are a powerful way to visualize work on a timeline and spot issues early. Many businesses of all sizes already use them. If your company hasn’t tried this tool yet, it may be worth considering.
Today, we’ll tell you everything you need to know about Gantt charts and share the best software options for project management in 2026.
What Is a Gantt Chart?
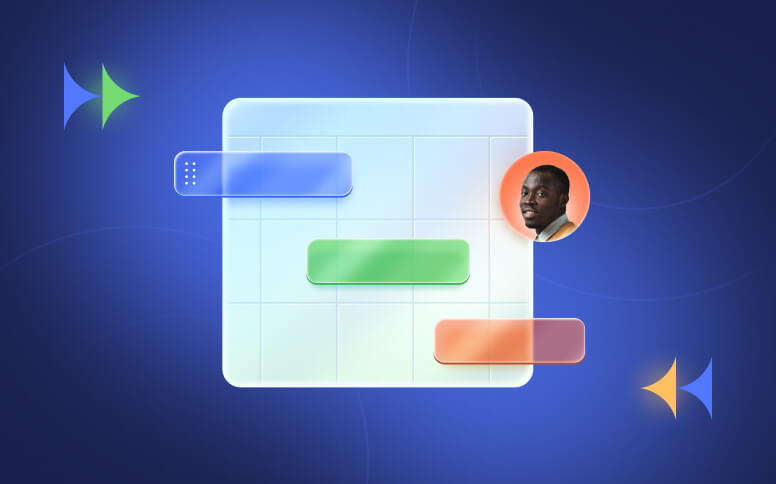
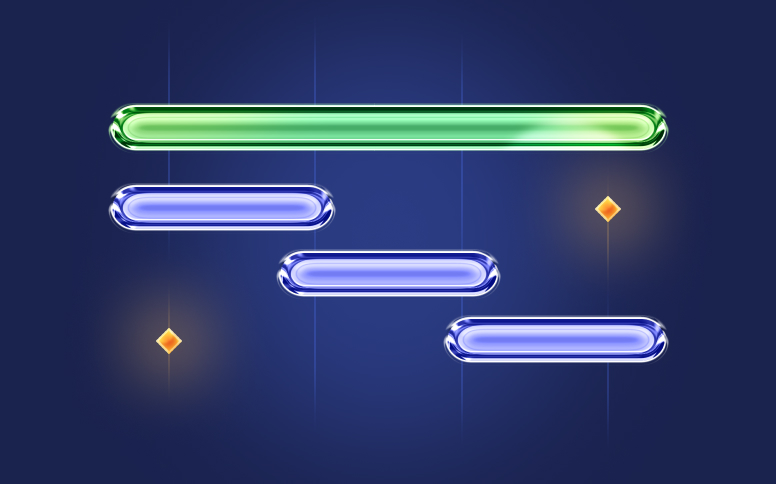
As its name suggests, it’s a chart where you can see tasks on the vertical axis and the timeline on the horizontal axis. Ultimately, horizontal bars are drawn to show how much time each activity takes.
Before you say that this isn’t enough, you’re not seeing the whole picture. This tool is a great help for planning.
On the chart, you can see exactly when a task begins and ends and add other details. For example, choose a person responsible for specific activities and the human and material resources needed to complete them. More importantly, you can view the task dependencies.
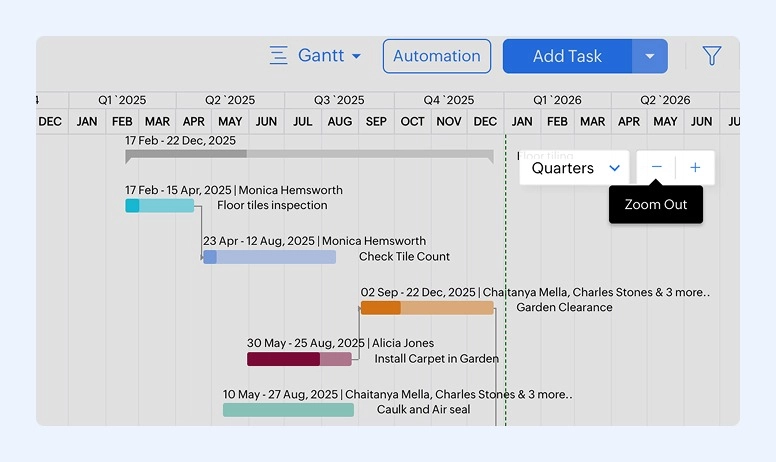
The best Gantt chart software in 2026 can actually change the colors of progress bars—they indicate whether a task has not started, is in progress, or is already completed.
Such visibility gives the manager valuable insight to ensure that the plan will be delivered on time.
6 Features the Best Gantt Chart Software Tools Need to Include
While there is a lot of software available, the truth is that you can get them with the best tools for project management.
However, no matter what you decide, Gantt charts need to include some specific features:
1. Dependencies
It’s important that the tool shows the manager how activities are related to each other. Often, one task must be completed before another can begin, and this type of tool gives you excellent control over these dependencies.
You should know that there are 4 different types of dependencies: Finish-to-start (FS), Start-to-start (SS), Finish-to-finish (FF), Start-to-finish (SF).
2. Milestones
Milestones are a feature that allows you to immediately know where you are standing at the moment.
One of the things you need to keep in mind is that milestones usually mark the end of a significant stage of the project. However, they don’t have a duration.
You can see them displayed on the chart in a diamond shape.
3. Critical Path
The critical path is essential for identifying the sequence of tasks that must be completed to meet deadlines. It allows managers to determine how long each action will take and how to allocate the team’s efforts to ensure timely project delivery.
4. Auto-Scheduling
While not all tools come with this feature, it’s very handy. The idea is that software automatically adjusts the project plan taking into consideration the dependencies. The tool also considers both lead and lag time.
5. Task & Project Progress
The Gantt chart should make it easy to track progress against the plan. Ideally, you can compare planned work hours versus actual work hours. With this in mind, the software should let you set task-level estimates and hourly budgets (or time/cost targets) to monitor variance.
6. Option to Export
The tool that you choose should allow you to export your Gantt charts. While this is not required, sometimes it can be pretty helpful to show these charts to stakeholders, clients, and team members.
Keep in mind that it can span a long timeline. So, the tool should have the possibility to zoom to fit before you export data to PDF format or an image. This is important to ensure the entire project fits in.
Advantages of Gantt Charts
Clear Visual Overview of the Project
The tool displays tasks, deadlines, and milestones along a timeline, making the entire project structure easy to understand at a glance. Compared to reading a simple list, a visual layout helps teams quickly understand sequencing and timing.
Improved Tracking of Progress
Because each task is placed on a timeline, it’s simple to see what has been completed, what’s in progress, or falling behind. This visibility makes it easier to compare planned schedules with actual performance and encourages team accountability.
Quick Identification of Scheduling Issues
Delays, missed deadlines, and broken dependencies are immediately noticeable. This allows managers to make timely adjustments before small problems escalate into major setbacks.
Disadvantages of Gantt Charts
Limited Effectiveness for Highly Complex Projects
When multiple tasks are highly interdependent, the chart can become crowded and hard to read. Rather than clarifying the workflow, it may cause confusion and reduce its effectiveness as a visualization tool.
Screen Space Limitations
Long-term projects that extend over months or years often require extensive horizontal scrolling. This can make navigation cumbersome and reduce the practicality of the chart in digital formats.
Difficult to Print Clearly
Large tables rarely fit neatly onto a single printed page. They either need to be divided across multiple pages or scaled down so much that task labels become hard to read.
The 12 Best Software to Create Gantt Chart in 2026
As we’ve mentioned above, there are many great tools on the market. Many project managers often ask, “Which is the best Gantt chart software?”. So, we’re going to show you only the 12 top of them.
Compare at a Glance
Before choosing a tool, many managers consult a best Gantt chart software comparison to see which platform offers the features, usability, and pricing that suit their team’s needs.
If you’re wondering what is the best software to make Gantt charts, there are several options that help teams plan tasks, manage resources, and track project progress efficiently.
|
# |
Tool |
Main Gantt Feature |
Pros |
Cons |
Price |
|
1 |
Flowlu |
Drag & drop, dependencies, Agile sprints |
Strong scheduling, auto‑scheduling, flexible views |
The tool is disabled on mobile; limited PNG export |
Free (solo), $9/user/mo |
|
2 |
ProjectManager |
Online vision, critical path, drag & drop |
Real‑time collaboration, intuitive charts |
May lack advanced features |
$14+/user/mo |
|
3 |
Zoho Projects |
Color‑coded elements, baselines |
Many integrations, interactive views |
Interface learning curve; needs Zoho Analytics for sharing |
Free & paid plans |
|
4 |
TeamGantt |
Nested tasks, baselines, guest access |
Multiple views, baseline compare, PDF export |
Editing dependencies requires extra steps |
Free (1 project), $24.95–$29.95/user/mo |
|
5 |
OpenProject |
Open‑source table, dependencies |
Unlimited users/projects, customizable |
Hard install; no mobile app; no resource % |
Free & paid plans |
|
6 |
Tom’s Planner |
Simple drag & drop, color blocks |
Very easy to use; short learning curve |
No third‑party integrations; single‑user edit |
Free–$19.95/user/mo |
|
7 |
Paymo |
Auto schedule activities, critical path |
Affordable; visual indicators; auto scheduling |
No undo; Gantt only in highest plan |
Up to $16.90/user/mo |
|
8 |
Wrike |
Dynamic timelines, baselines, critical path |
Good automation, many tools |
Manual updates; limited automation for Gantt |
Free–$124 (5 users) |
|
9 |
Toggl Plan |
Drag & drop start/end, public link |
Visually simple, instant updates |
No dependencies; no export |
Free–$18/user/mo |
|
10 |
GanttPRO |
Drag & drop, lead/lag, baselines |
Many export options; integrations |
No auto‑scheduling; basic reporting |
$8.90–$15/user/mo (annual) |
|
11 |
nTask |
Auto task duration, critical path |
Simple, color‑coded elements, issue mgmt |
No time tracking; no auto‑schedule or lead/lag |
Free (basic; Gantt in paid) |
|
12 |
Agantty |
Open‑source Gantt, mobile app |
Free, unlimited users, strong exports |
Limited UX; no critical path/dependencies for milestones |
Free |
Learn More About Each Tool
We’ve chosen solutions that offer flexible settings with a convenient interface, clear customization, and multiple settings: view controls, dependencies, drag-and-drop functionality, automations, and deadline management.
Not every tool below checks every box. Some are best for lightweight timelines; others are full PM suites.
Also teams looking to manage several initiatives at once often seek the best Gantt chart software for multiple projects to keep timelines, resources, and dependencies organized efficiently.
Here, you’ll find solutions for different issues and budgeting requirements.
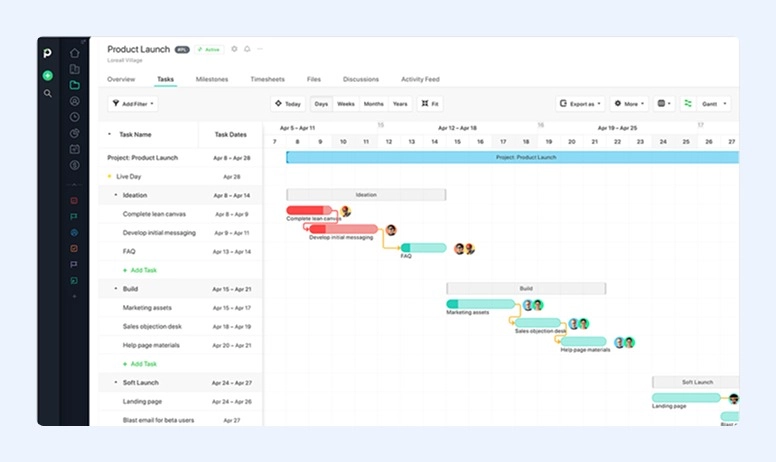
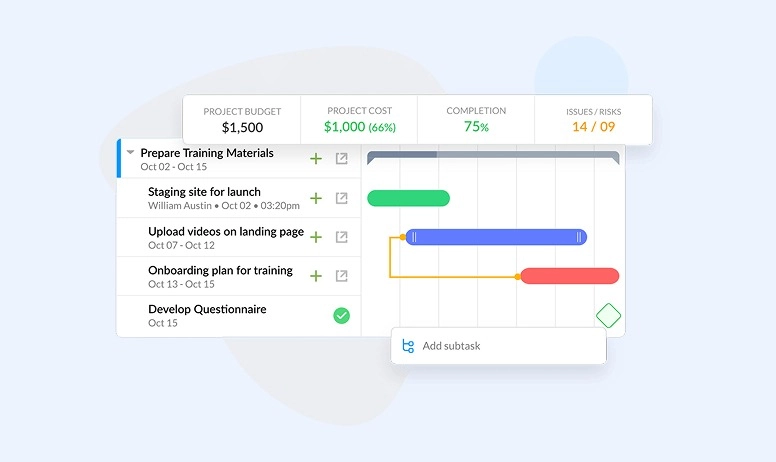
#1. Flowlu
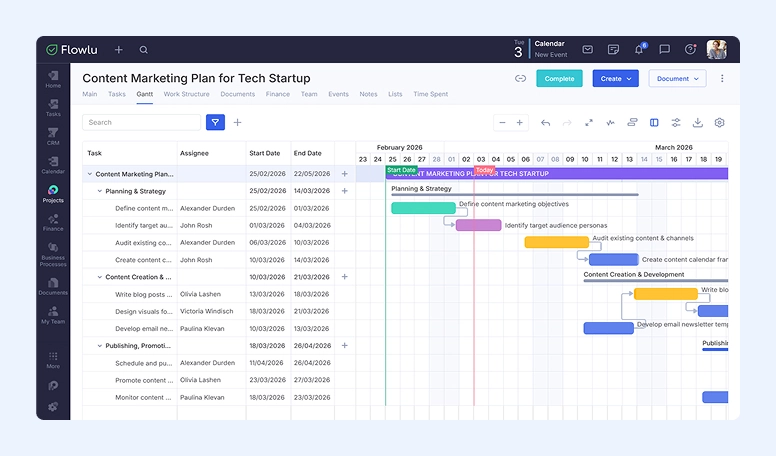
Flowlu is an all-in-one work management platform that includes project planning tools and a Gantt chart for visual scheduling. Its functionality shows work on a timeline and supports key planning actions like adjusting deadlines, linking tasks, and exporting timelines for stakeholders.
Flowlu also offers the same tool inside its Agile module, where the chart represents sprints or epics (with timeline scaling, drag-and-drop duration changes, and relationships between items).
This platform is often recommended as the best Gantt chart software for small teams, helping them plan tasks, track progress, and manage resources efficiently.
Key Features:
- Tables for tasks and projects (visual deadline adjustments via drag-and-drop)
- Dependencies (including multiple dependencies per task)
- Blocking dependencies
- Auto-scheduling toggle (when enabled, dependent tasks adjust automatically)
- Lead/lag support (delay/overlap can be set on dependency links)
- Gantt view controls (zoom/scale, hide grid, grouping by stage or assignee, configurable fields/columns)
- Critical path and baseline view (soon)
- Status visualization on the chart
- Export options: XLSX and PNG
Pros:
- Strong hands-on scheduling (resize bars, move elements, link work visually)
- Auto-scheduling + lead/lag available (useful for real dependency-driven plans)
- Flexible viewing (grouping + customizable columns/fields)
- Export to XLSX/PNG for sharing timelines externally
- Includes Agile-specific reporting (sprints/epics)
Cons:
- Not available on mobile app (only Kanban board + lists)
- PNG export is limited to the Gantt chart of a specific project (not global views)
Pricing:
You may start exploring Flowlu for free—they offer a trial for all plans. The cheapest—Essential—starts at $9 per user per month. If you’re going to use it solo or in a duo, the system is completely free.

#2. ProjectManager
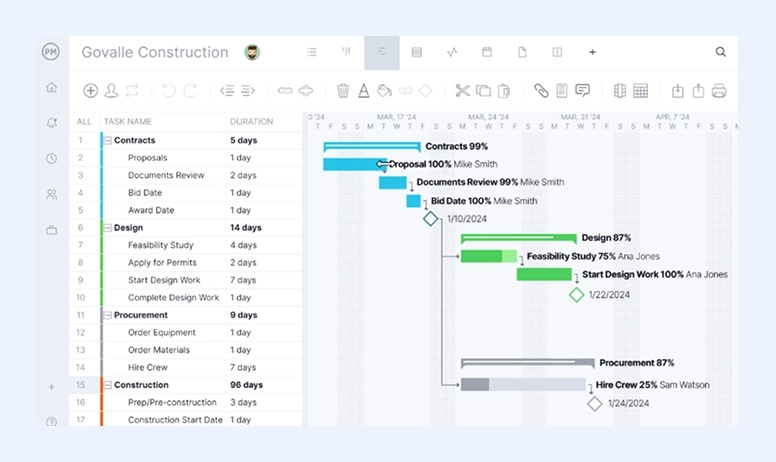
ProjectManager is a great tool that helps managers not only visualize but also organize and deliver their work. With this software, you can manage resources, build workflows, and plan your projects—all in real time.
This software allows you to do everything you need with Gantt chart, including planning, scheduling, setting milestones, and assigning work.
ProjectManager is much more than just a standalone tool. It helps managers rule their operations by using customized reports and real-time dashboards.
Key Features:
- Online Gantt chart maker
- Drag-and-drop scheduling
- Delivery deadlines
- Dependencies (all four types)
- Filters for the critical path
Pros:
- Real-time collaboration
- Elements can have colors and labels to be more intuitive
- Possibility of importing and exporting an Excel file, a Microsoft Project plan, and others
Cons:
-
May lack some features
Pricing:
ProjectManager comes with different pricing plans that range between $14 per user per month and a more complex solution that requires a talk with ProjectManager’s sales team.
#3. Zoho Projects
Based on the cloud, Zoho Projects is software that can be helpful to managers to plan new projects, keep track of the existing ones, and collaborate all the way through.
Zoho Projects allows you to use color codes in Gantt charts to easily know the most important tasks and dependencies. You’ll also like the fact that it alerts you when your actuals are deviating from the planned progress.
One of the best things about Zoho Projects is that you can customize almost everything on it. While it will take you time, you can personalize workflows, layouts, fields, and statuses.
Key Features:
- Baselines to compare what was planned to what’s happening
- Color coding
- Many integrations available, including Zapier, Microsoft and Google apps, Slack, Desk & Invoice, among others.
Pros:
- Dependencies that you can connect to tasks
- Drag-and-drop functionality
- Intuitive and interactive calendar view
- Many integrations
Cons:
- It may take you some time to adapt to the interface
- You’ll need Zoho Analytics integration to share your visual timeline
Pricing:
You can use the free plan, or sign up for a paid plan. Zoho Projects has 4 different ones to choose from, depending on your needs.
#4. TeamGantt
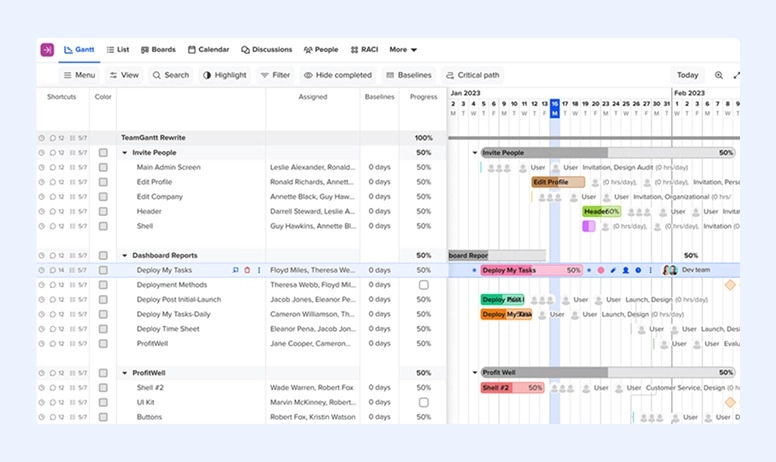
With a simple interface, TeamGantt is looking to improve a desktop-based app into a more collaborative tool. Here, you can easily add activities, task groups, and milestones on the timeline with the drag-and-drop. Besides, the system allows you to change colors to the bars if you want.
The feature we like most about TeamGantt is the baseline snapshot. You can take a screenshot of where you are and compare this progress with what you’ve planned. You can do it anytime during your work process.
With TeamGantt, you have the ability to share your chart with people outside the company. They don’t have the right to edit it, but they can view tasks and comment on them. Also, the platform gives users the option of printing their tables as a PDF file.
Key Features:
- Converts tasks to milestones and subtasks
- Baselining
- Project templates with dependencies
- Estimated hourly budgets
- Percentage complete progress
Pros:
- Create nested tasks, subgroups, and dependencies
- You can use multiple views, including lists, and calendar
- Compare the actual with planned baselines
- Guest user access
- Print charts in PDF
Cons:
- To edit or remove a dependency, you’ll need to open the details
- No lead or lag time
Pricing:
TeamGantt has 3 different plans available: a free for just one project and 3 users; the Standard plan that costs $24.95 per user per month; and the Advanced plan that costs $29.95 per user per month.
#5. OpenProject
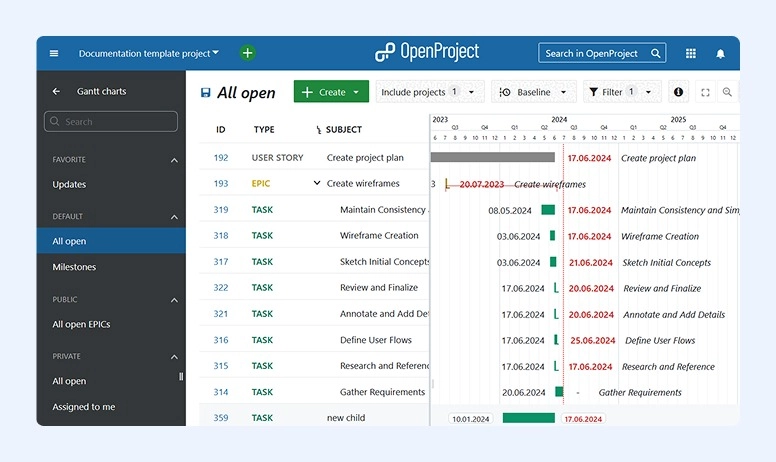
OpenProject is an open-source software that is completely customizable and adaptable to all businesses.
The OpenProject software comes not only with Gantt charts available but also with list views and Kanban boards. You will also find customizable templates and time-tracking tools inside.
Key Features:
- Open-source software that allows full customization
- Visual charts include dependencies and work packages
- Arranges tasks according to due dates
- Determines the start date by looking at dependencies
- Includes integrations with NextCloud, GitHub, and more.
Pros:
- Customizable element
- Unlimited number of users and projects
- Convenient organization feature with subtasks and subprojects
- Secure platform, GDPR compliant, and GNU GPL v3 licensed.
Cons:
- Installation isn’t easy
- No mobile app
- No resource percentage available
Pricing:
The OpenProject software can be used for free, but it also offers different paid plans.
#6. Tom’s Planner
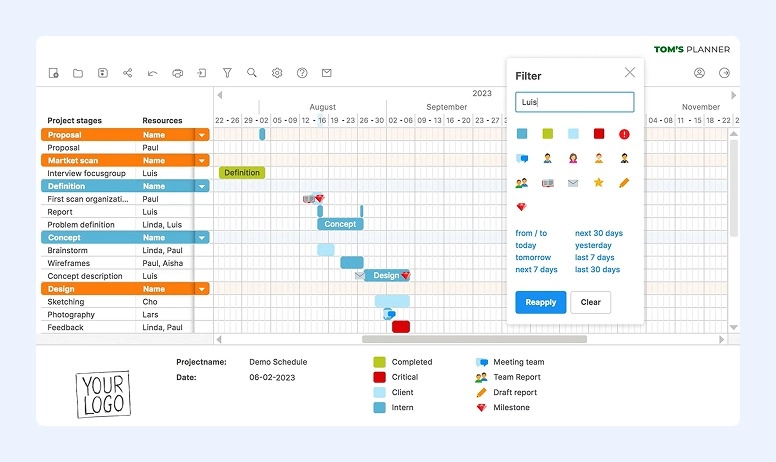
If you're looking for just Gantt chart software, you should consider taking a closer look at Tom’s Planner.
Tom’s Planner is an online software that is incredibly easy to use. Featuring drag-and-drop color-coded time blocks, you can also zoom in and out from the multiple views (hourly, daily, weekly, and monthly) and contract and stretch the bars to get more info.
Key Features:
- Entirely focused on Gantt charts
- Comes with ready-to-use templates
- Color time blocks and traffic lights
- Includes filters
- Create dependencies
- Free updates
- Printing and exporting options
Pros:
- Very easy to use
- Short learning curve
- Drag-and-drop tasks
- White labeling
- Track work status using colored time blocks, icons, traffic lights, or percentages
Cons:
- No third-party integrations available
- Edits can be made only by one user at a time
Pricing:
The Tom’s Planner cost ranges from free to $19.95 per user per month. Notice that you may get a discount if you’re a corporation.
#7. Paymo
Paymo is a complete project management software designed for up to 20 people that also comes with Gantt charts. With this tool, you can manage your clients, keep track of time, and send invoices.
You can start using it right away. In addition, you’ll be glad to know that whenever a task includes a start and an end date, Paymo will automatically add it to the timeline.
This software also allows you to add dependencies and milestones to ensure you can keep all projects on track. Besides, users can incorporate any delays or overlaps on the plan.
One of the things we really like about Paymo is that it includes a wide range of visual indicators to help employees get the most information with just a glance. Besides, the managers can also benefit from the critical path that shows the task chain that determines the project end date.
Key Features:
- Includes different project templates with dependencies
- Task duration is automatically drawn
- Lead and lag time included
- Critical path
- Ability to export tables to PDF or PNG formats
Pros:
- Very affordable when compared with other options
- Connect activities and manage dates by using dependencies
- Export to PDF files
- Automatic schedule
- Many visual indicators
Cons:
- No undo button
- The tool is available in the most expensive plan only
Pricing:
Paymo prices can go up to $16.90 per user per month. Even though the company has a free plan, you need to subscribe to the most expensive one to access Gantt charts.
#8. Wrike
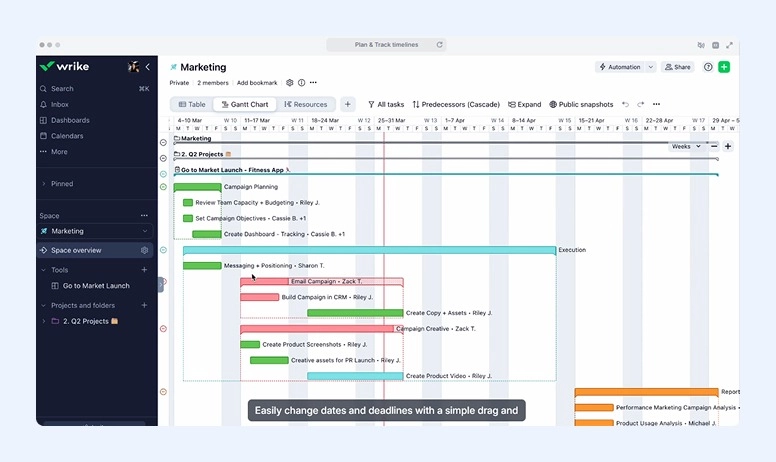
When you’re looking for the best Gantt chart builder software, you need to consider Wrike.
More than just a Gantt chart tool, Wrike is a complete project management app that allows you to import your timelines, their durations, assignments, and dependencies from Microsoft Projects or Excel. This will prevent a lot of errors and typos.
When it comes to adding tasks, drawing them is automatic. However, you need to always define a start and end date so that Wrike can build the chart.
As with other tools mentioned, you can see tasks in different colors depending on their status. However, you need to make sure that the “All Tasks” filter is selected, or you won’t see some statuses, such as activities on hold and completed actions.
Wrike includes dependencies and supports critical path visibility, but rescheduling is largely manual. It doesn’t support lead or lag time, and changes don’t automatically adjust the schedule across dependent tasks—so you may need to update dates yourself.
Key Features:
- Snapshots
- Multiple project management tools
- Drag-and-drop
- Dynamic timelines
- Project templates with dependencies
- Critical path
- Baselines
- Some reporting features
- Secure storage
Pros:
- Suitable for both small and large businesses
- Wide range of project management tools
- Automation in many areas
- Duration of tasks is drawn automatically
- Custom fields
Cons:
- Only the four main dependencies are available
- No automatic auto-scheduling available
- Many manual changes, which can lead to errors and time wasted
- No tracking of budget cost or completion percentage by default
- The lack of automation is very frustrating and time-consuming
- Export is only available in CSV
Pricing:
Wrike is a great option for businesses of all sizes, from small to large, and its pricing plans demonstrate this. Prices range from free for up to five users (though this plan doesn’t include Gantt charts) to $124 per month for five users. There is also a custom plan available.
#9. Toggl
Especially designed to be a good project management tool for agencies, Toggl comes with customizable systems, budget tracking, and work planner.
Featuring a simple design, Toggl Plan will first ask you to define your groupings and task lists and only then draw your elements using the drag-and-drop feature. You can set the start and end time of each action, as well as its estimated duration, with Toggl Plan. However, there is no time tracking available.
While this is a good tool, it doesn’t come with dependencies, which is a clear limitation. On the positive side, milestones are present.
In case you’re looking to share your work, you can use a shareable public link, but that’s it. There are no export options, and there isn’t a portfolio Gantt chart available.
Key Features:
- Set the time tasks start and end
- Manage workload
- Public shareable link
Pros:
- While it doesn’t have built-in time tracking, it connects with other tools to use it
- Visually attractive interface
- Real-time collaboration
- Instant updating
Cons:
- Lack of dependencies
- No time tracking available
- No exports are allowed
Pricing:
Toggl has a free plan and other paid options. You need to choose depending on the users and tools. Prices range from free to $18 per user per month, but they still have a different plan with custom pricing.
#10. GanttPRO
If you’re looking for the best online Gantt chart software, you need to look at GanttPRO.
While it began as a dedicated platform, it has been evolving into project management software in the last few years.
With GanttPRO, as soon as you create a project, you can simply import a JIRA or CSV file. Then you may set the working days and hours since they will influence the schedule.
All tasks that you add have start and end dates, status, priority, and hourly estimates. You’ll be glad to know that both dependencies and lead and lag times are included in GanttPRO.
We like the fact that this tool includes baselines as well as the critical path. In addition, budget reports and cost tracking are also part of the package.
When you need to show work plans to stakeholders, clients, or anyone else, you can use a secret link or export the chart as a CSV, PDF, Excel, or PNG file.
Key Features:
- Drag and drop tasks across timelines
- Prioritize projects and progress tracking
- Set dependencies
- Free templates with dependencies
- Time management and logs
- Bard views
- Workload management
- Export options
Pros:
- Customizable templates
- User-friendly
- Drag and drop
- Collaborative tools
- Many export options, including Excel, CSV, PNG, and PDF
- Create a shareable link for stakeholders to view the chart
- Many integrations, including Microsoft Project, Excel, OneDrive, Jira Cloud, Google Drive, Slack, and more
Cons:
- You can only have hourly estimates
- Auto-scheduling isn’t an option
- Reporting may be somewhat basic
- No free plan forever
Pricing:
GanttPRO prices vary between $8.90 and $15 per month, but you’ll always be billed annually. You can take advantage of a free trial to try it out.
#11. nTask
nTask is a very simple project management software that has more tools than just Gantt charts.
In what relates to tasks, you can actually monitor any delays on the project by adding the start and end dates to them. The platform includes priorities, billable status, and hourly budgets. You may even have a different color depending on the status of the task, which can be pretty handy.
One of the things that people like about nTask is that it comes with a feature called Issue Management. It allows users to record any issues that affect the lifecycle of a project and take care of the work promptly. On the negative side, the software doesn’t include any time tracking.
In what refers directly to Gantt charts, you need to know that nTask supports both the critical path and dependencies. But the auto-scheduling function isn’t available. This means that you’ll need to do it by hand.
Key Features:
- Automatic drawing of task durations
- Estimated hourly budgets
- Critical path
- Issue Management
- Progress line chart
Pros:
- Simple platform to use
- Color-coded tasks according to their status
- Issue Management feature
- Copy the Gantt chart and reuse it in other projects
Cons:
- Some users find the interface a bit strange since there are floating tasks
- No time tracking
- No auto-scheduling function
- No lead and lag time
Pricing:
nTask has a basic free plan. However, it doesn’t include Gantt charts. To have them, you’ll need to choose one of the other 3 paid plans the company has available.
#12. Agantty
If you’re looking for the best simple Gantt chart software, you should check out Agantty.
Agantty is free open-source software that allows you to draw your own visual tables.
You will find the most basic task details, such as start and end dates, assignees, dependencies, and hourly budgets.
There is no time tracking available. However, you can invite as many users as you want to check your Gantt chart, and there won’t be any problems exporting them.
In fact, you can export tables in different formats, including Outlook Calendar, iCal, or Google Calendar, in addition to the usual XML and Excel formats.
One of the best things about Agantty is its strict data security. You can also use the system as an Android and iOS app.
Key Features:
- Project and task duration
- Great data security
- Free
- Unlimited user guests and teams
- Many export options
- Mobile app for both Android and iOS
Pros:
- Open source
- Sort tasks chronologically by status (completed or not) and assigned users
- Strict data security
- Many export options
- Easy to share and distribute charts
- Easy to view the chart by team member, calendar date, among others
- Clear, delineated responsibilities and milestone dates
Cons:
- Lacks some UX functionalities
- Can’t set dependencies between a task and a milestone
- There are also no lists or groupings
- No critical path
Pricing:
Agantty is completely free.
What About Gantt Chart Alternatives?
Gantt charts also have disadvantages, and they might not be appropriate for what you need. So, there are alternatives to this tool when it comes to project management.
Here are 3 other tools you can use:
1. Kanban Boards
These are tools that you can use to visualize tasks and projects evolving. Most Kanban boards usually have three main columns: To Do, In Progress, and Complete. You can add activities and move them around depending on whether you’ve just created the task, already started working on it, or completed it.
These tools are extremely easy to use. They’re flexible and adaptable. When using it, project managers can easily identify bottlenecks.
2. PERT Chart
A PERT (Program Evaluation Review Technique) chart is another alternative to Gantt charts.
These tools also show the relationship between the different tasks. However, its visualization is different. In this case, users see actions in a network diagram with nodes.
With this tool, you can determine the average duration of a task instead of using its actual duration. This allows you to create either a pessimistic or optimistic project schedule.
3. Calendars
You may also use Calendars instead of Gantt charts. Some of them can also display the tasks on a horizontal bar. However, it’s not possible to set dependencies.
Calendars may be a good solution for daily operations instead of using them as a replacement for Gantt charts. However, there is an exception: if you just need to follow the task’s chronological order, a calendar will perfectly suit you.
Make Your Workflow Visible
Many teams are looking for the best software for Gantt chart creation to plan projects efficiently and track progress in real time. There’s no question that visual timetables are a great and helpful tool for this. Whether they’re included in a more complete solution, like a CRM or other project management tool, or are standalone software, you should consider using them.
Keep in mind that Gantt chart software isn't all the same. Some of them may work better for you than others—everything depends on the features they include. So, just check our table for the best Gantt chart software tools comparison to quickly see which platform fits your team’s needs.
If you don’t want to clutter your workspace with different apps for each process, use universal solutions. For example, platforms like Flowlu incorporate all essential tools in a single workspace. Here, each team member can track task and project progress with clear visibility and an organized, structured Gantt chart functionality.

It is a chart where you can see tasks on the vertical axis and the timeline on the horizontal axis. Gantt charts are a project management tool that helps managers plan, schedule, and keep track of all tasks in a visual way. It should also automate some updates as well as highlight milestones, manage dependencies, and more.
Gantt charts should help users set milestones, visualize all the steps of the project, create dependencies, drag and drop tasks, and update schedules in real time.
Some of the solutions also allow collaboration and reporting.
You should remember that free tools often come with fewer features than paid ones. However, depending on your needs, you may find the most basic features sufficient.
In this industry, people often use Zoho Projects and ProjectManager.
Many teams in the U.S. use Wrike and GanttPRO to streamline planning, track tasks, and manage resources effectively.