


Sales KPIs Your Team Should Track for Performance and Revenue Growth

- What Are Sales Team Performance Metrics and KPIs?
- Why Sales KPIs Matter for Small Teams
- The Importance of Sales KPIs for Growing Teams
- Types of KPIs for Sales Teams
- How to Implement KPIs in Your Sales Team
- What KPIs Different Sales Teams Use
- What KPIs Work Best for Sales Teams
- How to Overcome Common Mistakes with Sales Team KPIs
- Build a KPI System That Your Sales Team Trusts

Comprehensive financial estimation is based on KPIs — key performance indicators. These metrics disclose the strengths and weaknesses of your sales processes. If you track KPI data, you can optimize sales strategies, make quick adjustments, forecast outcomes, and ultimately influence profitability.
The total number of different KPIs is huge. To avoid getting lost in metrics, we’ve prepared a clear guide to help you choose only the essential sales KPIs that fit your business.
What Are Sales Team Performance Metrics and KPIs?
KPI (Key Performance Indicator) in sales is a parameter that assesses the effectiveness of an employee, department, or business as a whole.
KPIs in sales serve as control points, and team agents put the metrics’ results in their reports. According to them, managers monitor and adjust the work of the sales department.
There are more than 20 KPI you can use to measure the quality of a sales team's work. However, in practice, only about 5–10 are usually enough to track commercial progress and steer it in the right direction.
The exact number of active KPIs depends on your industry, specific business goals, and team size.
Why Sales KPIs Matter for Small Teams
When managing small teams, the exact choice of metrics and their clear definition are especially important, because:
- Small teams have few resources. That’s why its reasonable allocation is on a high purpose.
- New businesses are more risk-averse. Properly selected metrics will help prevent unpleasant consequences, and even save young companies from fast ruin.
Small business sales teams usually consist of 1–5 employees. This means you should choose only a few KPIs that are achievable and easy to track — without overwhelming your staff with too many numbers. On average, 5–7 KPIs are enough.
The Importance of Sales KPIs for Growing Teams
With a scaling business, the wise selection of KPIs for sales teams matters, because:
- It boosts growth. KPIs reveal the weak and strong sides of the business’s processes and give exact directions for corrections or scaling.
- Help optimize budgeting. KPI’s results show what projects are worth investing in, and what employees should be paid more or less.
Tracking sales team KPI effectively helps boost ROI and become leaders in your industry by identifying top performers and optimizing strategies.
Types of KPIs for Sales Teams
Observing the large number of KPIs for the sales team, we’ve selected the popular ones and divided them into four main groups for convenience.
#1. Revenue and Outcome KPIs
This block consists of metrics directly tied to your budget, showing the results for the money spent or earned over a set period.
1. Revenue Growth Rate (RGR)
Show how your revenue growth term-after-term — month, quarter, or year.
Why do you need this KPI for sales:
RGR helps determine whether your overall sales strategy remains profitable. Analyzing this metric supports strategic decision-making at all levels of the company.
How to calculate:
RGR = (Current period revenue - Previous period revenue) / Previous period revenue
To express it into percentages, multiply the result by 100.
Preferred result:
Your company shows strong potential if revenue growth is around 10–20%.
2. New Business Revenue (NBR)
This KPI may seem obvious, but it’s essential for evaluating new acquisitions. It tracks the income generated from first-time buyers.
Why do you need this KPI for sales:
Using NBR, managers can determine whether the chosen sales direction is effective and has the potential to attract more new customers.
How to calculate:
NBR = Number of items sold × Average price per product or service
It’s best to track new revenue on a monthly basis and compare it to your target as a percentage.
Preferred result:
If new sales account for around 30% of total revenue, it’s a strong result that demonstrates healthy growth performance.
3. Recurring Business Revenue (RBR)
This KPI shows how much of your total revenue comes from your existing client base. The main sources of this kind of revenue are reorders and cross-selling.
Why do you need this KPI for sales:
RBR helps estimate the value of existing customers. This metric reveals when accounts are becoming less active and may need re-engagement. Sales reps can then focus on these specific clients to improve retention. Managers usually monitor recurring revenue once a month — Monthly Recurring Revenue (MRR).
How to calculate:
MRR = Average revenue per customer x Number of paying customers
Preferred result:
Good results depend on your business niche. In most industries, about 70% of total revenue should come from customers who make repeat purchases.
#2. Pipeline and Conversion KPIs
The next group of KPIs incorporate metrics that show how effectively your sales team converts leads into loyal customers. Concrete data helps estimate the quality of your pipeline, identify bottlenecks, and prevent lost opportunities.
There is no single universal benchmark for these KPI, as each industry has its own success metrics based on unique experience and the most profitable examples.
1. Conversion Rate
With this KPI, sales reps see how many leads they managed to turn into customers.
Why do you need this KPI for sales:
The number of visitors who move toward a target action reflects the success of your recent sales strategy performance.
Maybe it’s your sales pitch that went win, or your friendly site's interface engaged users to make a buying decision. Low conversion rate, vice versa, indicates a problem you need to solve as fast as possible not to lose new deals.
How to calculate:
CR = (All conversions / All lead ) x 100
To find your ideal conversion rate, compare your results to previous data over time. If you’re new to your niche, check competitors’ benchmarks within the same industry or use special analytic tools, like Google Analytics.
2. Sales Cycles Length (SCL)
Measures how long it takes for a client to complete the desired action after first interacting with the product.
Why do you need this KPI for sales:
Knowing the approximate length of your client’s pipeline makes it easier to plan a sales campaign. Also with this KPI salespersons see clearer what engages users to purchase, or what makes them hesitate. Both good or bad experiences give managers ideas to improve the client's way and make it faster and more convenient. Overage Sales Cycle Length usually measures in days.
How to calculate:
SCL = All days for all deal / Total number of deals
3. Win Rate
It needs to calculate the percentage of deals that were closed successfully. “Won” opportunities mean the client agreed to the terms and signed the contract, and you are ready to start the work.
Why do you need this KPI for sales:
This metric enhances the team’s insights by revealing which actions work and which lead to poor outcomes. All of this information helps optimize the customer journey through the sales funnel. Sometimes the Win Rate indicates not flaws in your personal actions, but an incorrect choice of prospects. High KPI results can also serve as proof of your leadership in the industry.
How to calculate:
WR = (Win opportunities / All opportunities) x 100
To stay organized and analyze data effectively, track your pipelines using digital tools. For example, Flowlu lets you capture opportunities directly from your website forms or email campaigns. The app visualizes all pipeline stages, allows client invitations, and provides detailed descriptions for won or lost deals.
#3. Activity and Productivity KPIs
In this group, we gathered metrics that indicate how well your team or separate employees achieve company’s goals. If you’re searching for solutions to boost sales staff’s effectiveness, start tracking the following KPIs.
1.Task Completion Rate (TCR)
It’s a measure that shows how successfully a specific type of task is typically completed.
Why do you need this KPI for sales:
This metric is useful in sales project management when you need to estimate general team productivity or results from individual sprints. TCR is really helpful for checking the effectiveness of frequently performed, repetitive tasks. Also, if you have a website, TCR will help you evaluate user satisfaction with your interface and navigation. Sometimes, low conversion stems from a confusing feedback form or unclear CTA wording, rather than a sales rep’s “human” errors.
How to calculate:
TCR = (Number of successfully completed tasks / Total number of task attempts) x 100%
2. Team Velocity
A KPI used by teams working with the Agile methodology. It shows how fast and how many tasks employees complete per sprint. Team Velocity is usually measured in Story Points — hypothetical units of measurement, which may be based on different actions, for example, cold calls made, email sent, demos presented, etc.
Why do you need this KPI for sales:
Team velocity makes your workflow predictable. If you experience once how many points are optimal for your team, you’ll know exactly what scope of work to assign in the next sprint. This allows you to gradually increase KPIs without risking employee burnout.
How to calculate:
TV = Total Completed Story Point / Number of Sprints
For those just starting to implement Agile, it can be difficult to understand which data to use as a starting point for work planning. In such cases, we recommend using digital tools.
For example, Flowlu offers a comprehensive Agile module where you can find all the necessary estimation tools. Here you can take your first steps without fear of doing something wrong. These tools help you plan your goals and determine how much work your team can accomplish within a set period, for example, 2–4 weeks.
Just go to Agile Board to visualize your workflow with Scrum and Kanban Board and start your first sprints.

3. Lead Time and Cycle Time
They usually go together because the first metric encompasses the second one. Lead Time measures how long it takes from the moment you take responsibility for a task until it is completed. LT includes non-active working time — for example, the period before the team begins active work, as well as any waiting or queuing time.
Cycle Time, on the other hand, measures how long the direct workflow itself takes.
Why do you need this KPI for sales:
Time spent on completion says a lot about team productivity and helps plan future work. For example, when you’ve already known your salesperson usually spends 2 hours customizing sales pitches, you can assign him the optimal amount of tasks for day or week. If a specialist falls behind schedule, you can quickly discuss the issue and resolve it.
Data obtained from these kpis also helps clearly communicate accurate delivery timelines to customers.
How to calculate:
LT = Waiting time (in the queue) + Working Time (Cycle Time) + Time for acceptance/delivery
CT = Finish time - Start time
To understand how much time your employees spend on tasks, use dedicated digital time-tracking tools. If you need a more comprehensive and flexible estimation approach with analytics and reporting, consider using task management tools from Flowlu.
#4. Customer and Retention KPIs
The last group combines KPIs that measure how effectively your business works with clients to retain them.
1. Customer Retention Rate (CRR)
One of the key KPI that shows what percentage of customers you managed to retain over a certain period of time.
Why do you need this KPI for sales:
CRR shows the actual number of loyal customers. It also reflects your ability to build long-term, trust-based relationships with your brand’s audience. You achieve strong results when customers remain satisfied with product quality and customer communication. They are likely to recommend your brand to others. The success is proved in repeat sales statistics.
How to calculate:
CRR = ((Customers at the end of the period - New customers for the period) / Customers at the beginning of the period) x 100%
Preferred result:
The ideal rate varies by industry, but a CRR between 70–80% is considered strong.
2. Customer Lifetime Value (CLV)
This KPI shows how much profit a company expects to earn from a single client over the entire duration of their relationship with the business.
Why do you need this KPI for sales:
CLV is essential when you’re trying to understand the overall budget for a retention strategy. It also helps answer whether it’s profitable to invest in retaining certain customer segments.
How to calculate:
CLV is quite a complicated KPI with a lot of input data required.
CLV = (Average purchase value × Purchase frequency × Average gross margin × Customer lifespan) - Customer acquisition cost
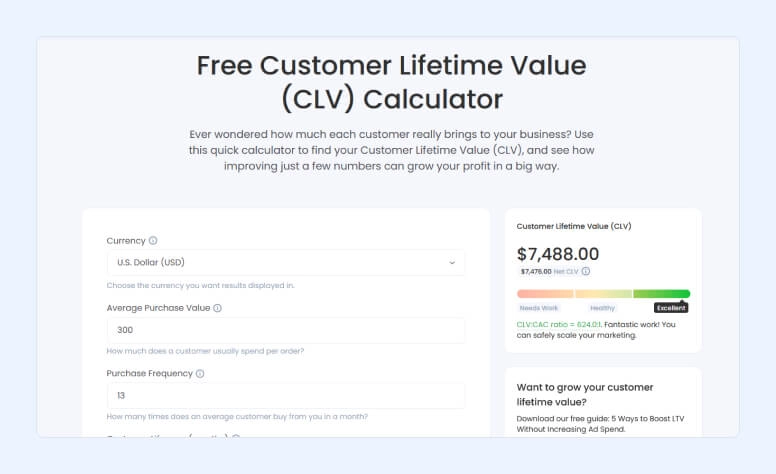
Not to rack your brain in calculations, better use Free CLV Calculator from Flowlu.
Preferred result:
After completing the form with your numbers, the tool shows you if you can scale your marketing camp or work on improvements.
Modern technology allows managers to track sales team KPI in real time, improving efficiency and results. Using the right software as well as AI-powered tools makes tracking your team’s sales KPI simple and fast.
3. Customer Satisfaction Score (CSAT)
This KPI helps to find out how satisfied customers are with your product or their interactions with your business.
Why do you need this KPI for sales:
The answer is simple: happy customers are the foundation of a successful prospecting strategy. If they aren’t satisfied, your profits will reflect that as well.
How to calculate:
CSAT = (Number of satisfied customers / Total number of survey responses) x 100
Preferred result:
A 70–80% satisfaction rate is solid. If this KPI reaches 90%, your work with clients is exemplary.
How to Implement KPIs in Your Sales Team
Let’s move to practice and see what steps help you to add and manage KPIs — from selection to the tracking process.
To choose appropriate KPI, analyze your business and answer the following question:
- What’s the company’s main goal? Do you want to sell more products, attract new clients, or retain existing target audience?
- How large is your sales team? Don’t track too many metrics when your staff is small.
- Do you have a motivation system? New KPIs should either naturally expand your existing incentive measures or help you build a new one.
- What resources does the company have? If you want a comprehensive view of your workflow, you’ll need additional digital tools. Some of them aren’t free.
Setting of exact numbers comes down to your team’s practice and experience. But how do you set targets if you’re new to the business or haven’t tracked a certain activity yet?
Stick to two main advice that guides your attempt to find the right KPI targets:
1. Start tracking activity.
For example: start calculating the number of calls, pitch emails, follow-ups, or demos your salespeople handle. These actions are easy to track and adjust for a beginning.
2. Explore your niche kpis.
For example: if the average number of deals in your niche is about 10, have your team aim for 7. This prevents employee burnout and allows room for development.
Don’t rush to apply the results to your company. Use them as an ideal outcome, not a strict rule. Adapt general industry KPIs and reduce them by about 30%.
How to Track and Review Sales Team KPIs in CRM
The importance of a KPI lies not in collecting precise statistics, but in interpreting the results. Let's see how to do it fast and clearly with the CRM module in Flowlu.
Start With Short-Term to Check Results
Building your database on short-term performance is the optimal way to monitor activities and quickly optimize them.
For example: track the number of follow-ups every two weeks. Compare these over time and determine whether the team can increase their efforts next month.
In Flowlu managers can create tasks within opportunities and monitor completion with a time tracker.
The task owner may add a time estimate, while the assignee can log the actual time spent with a description after the task is complete.
![]()
Both time entries feed into statistics to visualize how your estimates compare with actual figures.
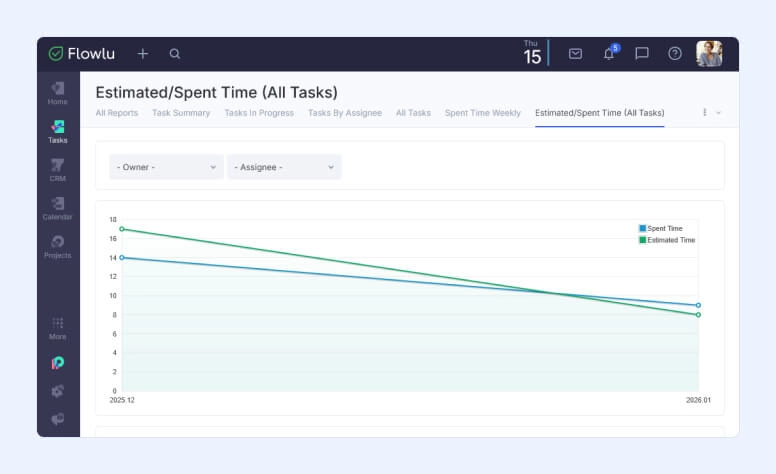
If you work in Agile, you can use automation tools here to calculate Lead Time and Cycle Time. Analyzing helps to find perfect time conditions for your employees to complete their tasks.
Adjust Your KPIs to The Sales Cycle Length
This step is possible once you have gathered some data and have clearer expectations of your team’s abilities.
For example: if your sales reps close a deal within 1–2 weeks, that means you can check and adjust targets every week. If the sales cycle length is about a month, you don't need to focus on immediate sales, but rather determine what to do to boost pipeline speed.
Compare Results With Industry Standards
If you are not sure what parameters your company should achieve at this stage, check the results your competitors usually show.
For example: if you’re working in the SaaS industry and the average number of demos here is 5 per week, set that result as the ideal. At the same time, allow your team to prove their effectiveness with 3 or 4 to start.
After you take on more projects and expand your financial system, you can choose from many metrics to track revenue in Flowlu. Study profit and loss, or income and expenses, to determine if your results are in line with industry standards.
Add New KPIs Gradually and Customize Them for Each Employee
For example, in Flowlu, you can add or remove necessary KPIs on your dashboard to track certain metrics in real time. If you're a Sales Director, it will be convenient to customize your dashboard with Sales Conversion Rate or Average Opportunity Value.
To add these KPIs:
- create a new dashboard and give it a name, e.g., “Sales Director”;
- click “Add widget” and choose the relevant widgets from the CRM section;
- customize each metric to track a certain timeframe, pipeline, or project.
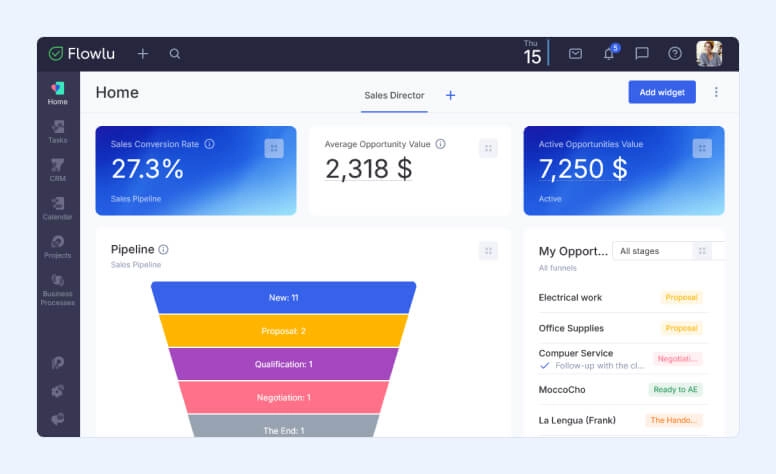
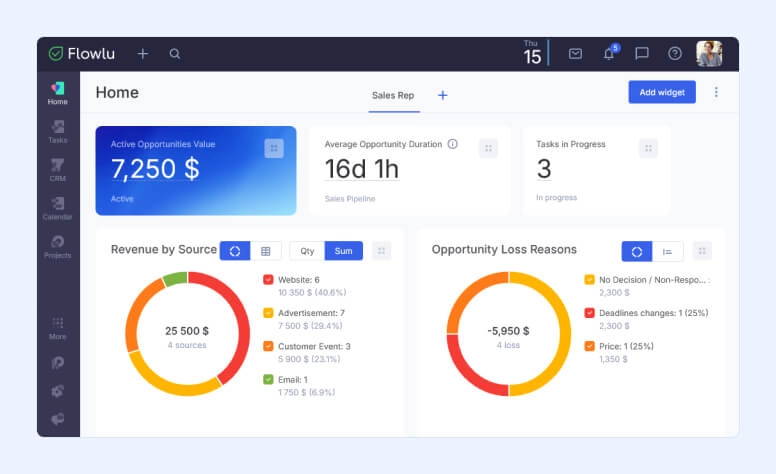
For sales representatives, a "Sales Rep" dashboard might include the following:
- See won or lost opportunity statistics
- Explore loss reasons
- Study active opportunity value
- Track how long it takes to close a deal with Average Opportunity Duration
- See which sources bring more revenue
Visualize all parameters and track pipeline statistics changes every day.
Track different metrics with Flowlu and keep your business clear and organized from the very first steps.
What KPIs Different Sales Teams Use
Real-life examples of kpis for sales teams demonstrate which metrics help achieve success regarding specific operations and goals.
Sales Development Representative (SDR) or Outbound Teams KPI Examples
SDRs operate at the first stage of the pipeline and focus on sales development. They interact with potential audiences and search for new clients through cold calling, email pitches, and social network communication. The main focus of the SDR team is to qualify leads, warm them up, and pass them on to Account Executives.
These tasks are best measured by activity-based metrics. For example:
- calls made,
- emails sent,
- social media touches,
- leads converted to meetings,
- meetings booked,
- opportunities created.
Advanced KPIs may include tracking:
- Speed to lead. How much time it takes from the moment a lead arrives to the first contact with the rep.
- Response rate. How many emails were replied to, calls answered, etc.
- Lead source. Where clients originated (e.g., calls, emails, etc.).
KPI Examples for Account Executive (AE) or Closing Teams
This covers the middle to final stages of the sales funnel. These representatives work with qualified leads and convert them into paying customers. Members of the AE team are responsible for the entire deal until it closes. They solve clients’ pain points, run demos, sign contracts, and drive general company upsells.
To estimate productivity of the AE team, use KPIs that focus on revenue, deal quality, and execution efficiency — not just activity.
Measure your Account Executive managers’ productiveness with:
- Revenue Closed;
- Sales Cycle Length;
- Win Rate;
- Pipeline Value;
- Conversion Rate;
- Forecast Accuracy.
You may also use more KPIs:
- Deal Velocity. Tracks the speed of a deal from the first touch to contract signing.
- Churn Rate. Shows the percentage of clients the company lost over a specific period.
- Expansion Revenue. The income that existing customers generate beyond their initial purchase (upsells, cross-sells, and so on).
Examples of Sales KPIs for Account Management and Expansion
The account manager is a bridge between the company and the client. He knows how to build trustful relationships that last for the long term. To track an AM’s work, use parameters that focus on retention, growth within existing accounts, and durable customer value.
Measure your Account Manager's productivity with these KPIs:
- Customer Retention Rate;
- Churn Rate;
- Customer Lifetime Value;
- Customer Satisfaction Rate;
- Revenue Growth Rate;
- Expansion Revenue.
More important KPIs we haven’t described early:
- Net Promoter Score. This KPI shows if your clients are ready to recommend your brand to friends and family. Companies usually use a 10-point scale to ask customers to rate their sentiment toward a product or service.
- Upsell and Cross-sell Rates. These metrics calculate how effectively you sell complementary services and how successfully you move clients to higher-priced items. These two types of additional selling can significantly boost your total revenue and CLV.
- Net Revenue Retention (NRR). One of the key metrics, especially in subscription businesses. It indicates the extent to which the company has been able to maintain and increase revenue from existing customers over a specific period.
What KPIs Work Best for Sales Teams
Each sales team chooses the metrics that show essential parameters for their business. As there is no universal kit of KPI, we advise select and set kpi for sales teams that indicate different aspects of business development: revenue, team and personal productivity, motivation, clients satisfaction, etc.
KPIs for Small Sales Teams
To evaluate different aspects of the sales process, you can select one KPI from each group described above.
Let’s see an example of better sales team kpis for small team:
From the Revenue and Outcome Group — Revenue Growth Rate.
Start by tracking it monthly. This will help you see whether your small team is making progress or heading in the wrong direction.
From the Pipeline and Conversion Group — Conversion Rate.
It’s easy to calculate how many leads you generate each month and how many of them convert into customers.
From the Activity and Productivity Group — Lead Time and Cycle Time.
These are among the easiest KPIs to track. They don’t require complex tools and are very useful for real-time monitoring and planning.
From the Customer and Retention Group — Customer Lifetime Value (CLV).
Although this kpis for the sales team can involve more complex calculations (unless you use tools like a CLV calculator), it helps determine where your money is best spent. This insight is especially important for small businesses with limited budgets.
Add More Specific KPIs:
For example, you may fix how many meetings each sales rep books, or find your average deal value. To calculate the last, divide the total revenue from all deals by the number of deals closed during the set period.
Setting clear sales KPIs for a small team helps focus efforts, measure performance, and boost overall results efficiently.
Sales Team KPIs for Scaling Teams
When a sales team is scaling, KPIs should focus on predictability, efficiency, and repeatability, not just raw activity. Expand your KPI set to 10–12 metrics to track performance effectively.
For example, your list of KPI can look like this:
- Revenue Growth Rate
- Monthly Recurring Revenue
- Conversion Rate
- Sales Cycles Length
- Team Velocity
- Lead Time and Cycle Time
- Customer Retention
- Customer Lifetime Value
- Customer Satisfaction Rate
Add More Specific KPIs:
Revenue and Outcome — Forecast Accuracy. It shows whether your forecasts were accurate. FA compares how close the predicted data were to the actual results.
Formula:
FA = (Forecast - Fact) / Fact
Pipeline and Conversion — Pipeline Coverage. This metric measures whether the current volume of opportunities in your sales pipeline is sufficient to meet planned revenue goals.
Formula:
PC = Total pipeline cost / Sales plan (Quota)
Team productivity — Sales Quota Attainment. This KPI shows what percentage of the sales plan (quota) was achieved by the team.
Formula:
SQT = Actual sales / Sales plan (quota) = % of plan completion
How to Overcome Common Mistakes with Sales Team KPIs
We understand how complicated KPIs can seem, especially for those who are just learning the ropes. There are many metrics, indeed. Some are difficult to calculate, while others take a long time or special tools to get a reliable result.
Unsystematic implementation can ruin your attempts at proper organization. But when you know where to focus in advance, you can avoid common pitfalls.
Here are seven “DON’Ts” to help you prevent these mistakes:
- Don’t Use Too Many KPIs: Remember that about five metrics are enough to track for small sales teams at the same time.
- Don’t Apply the Same KPIs for Different Positions: It is a mistake to use activity-based metrics for Expansion roles, or advanced KPIs for SDRs.
- Don’t set goals that are impossible to achieve: People often mistake their unfeasible ideas for ambitious ones. To ensure you get it right, check if your goals correspond to the SMART model.
- Don’t implement new KPIs or change old ones without informing your team: As KPI is closely connected with the motivation system, employees have the right to know what affects their salaries or additional bonus.
- Don’t Use KPIs for Punishment: Remember that KPIs are created to evaluate and improve performance. They are part of the incentive system by design.
- Don’t Forget to Check KPI Effectiveness and Adjust if Necessary: Over time, you will realize whether you need to simply change the target or remove the metric completely. For new sales teams, revise KPIs every 2–3 weeks. For growing and mid-sized teams, review them once a month or a quarter.
- Don’t Stick to a Single Set of KPIs: Always try to estimate different aspects of your business. The more data you have, the more ideas for improvement you will generate.
Build a KPI System That Your Sales Team Trusts
KPI implementation is a continuous process of trial and error. Each company has unique nuances. That’s why there is no universal list of best KPIs for the sales team that suits you perfectly.
To evaluate your team's work correctly, be ready to conduct a thorough analysis. Study your processes, highlight the essential ones, explore your team’s capabilities, and align all these specifics with the primary goals of your business.
Do not use KPIs only for formal evaluations. They should become a flexible system that helps increase employee productivity through workflow transparency. Use sales KPIs for encouragement, not punishment. Let them promote clarity — the core principle of a successful business.
Automate KPI tracking with universal CRM systems like Flowlu, where you can customize the dashboard and visualize all metrics in one place.

Sales metrics are anything you can measure as simple data points. You typically don’t need a formula to calculate them. In sales teams, metrics are usually used to track the volume of daily activities. For example, how many calls managers make, emails they send, or demos they run.
Sales KPIs are also metrics, but they are more complex. They are tied to the company's main goals and reflect complex processes, like revenue, retention, and client satisfaction. You can’t simply count sales KPIs. There are specific formulas to calculate them.
Always start with the basics — a maximum of 3–5 KPIs for different teams or each role. If you want to add a new metric, first re-evaluate the priorities in your current operations.
For example, you have shifted focus from retention to acquisition. The first thing you need to do is reduce the number of KPIs that track the previous priorities. Only after removing those should you can set new sales KPIs.
Also, review KPIs at least once a quarter. Ask for feedback from your teams or managers. They know best which metrics actually work in practice.
Don’t just study separate numbers, but always compare results over time. This gives you a comprehensive picture of process development and effectiveness.
Also, analyze metrics in relation to other KPIs. Sometimes, good results in one area don't indicate overall success. For example, what’s the point of a high CSAT score if your business revenue is dropping? Always start your analysis with the high-level KPIs that reflect your company’s goals. After that, drill down to those with lower priority to find what influences growth or decline.