


Analytics in Project Management: Tracking What Really Matters


Are you a project manager who’s drowning in updates, task lists, and endless spreadsheets?
And even with all of that data, it still feels hard to answer simple questions like …
Are we on track? What’s going wrong? Where do we step in?
The truth is, manual reporting doesn’t deliver what teams need to succeed. It shows what’s already happened — not what’s happening right now or what will happen next. And the problem is that without real-time actionable insights, delays go unnoticed, scope creeps quietly, and budgets bleed out slowly.
Effective project management demands more. You need real-time analytics capabilities that cut through noise and bring clarity to your projects.
Let’s look closer at why you need analytics in project management and how to turn those data-driven insights into decisions that improve delivery.
Why Analytics Are so Important: The Cost of Poor Visibility
In project management, visibility is everything. Without it, your timeline, budget, and team momentum are all operating in the dark.
And the cost of that blind spot? A reputation for not meeting customer and stakeholder expectations.
Let’s explore what happens when you don’t have visibility into project progress in real time.
You Waste Time
Here’s what research says about project managers:
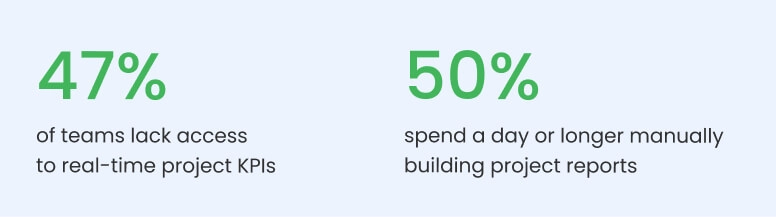
Project managers are ending up working from outdated snapshots. (They’re digging into yesterday’s data to make decisions about today’s project.)
But in fast-moving environments, even a few hours can shift priorities, risks, or resource needs.
By the time you take action, the situation has already changed. So what looked like the right move on paper … ends up steering your team in the wrong direction entirely.
For example, imagine approving a scope change based on available bandwidth, only to realize a key team member went on leave that morning.
Without live data, you can’t make up-to-date decisions.
On top of this, you’re slow to react.
When teams can’t see performance or risks in real time, they miss early warning signs. Instead of catching a slip while there’s still room to adjust, you only see the damage once you’ve failed to meet customer expectations. And these delays can often mean the difference between a quick pivot and a full-blown recovery effort.
Scope and Costs Balloon
Scope creep doesn’t usually start with a major change. It often begins with one extra request, one “just in case” task, one client tweak that doesn’t seem big enough to log.
But over time, these small additions build up.
Real-time analytics stop the spread by flagging every change to the project scope as it happens. With structured data and thresholds in place, you can track how each request impacts timelines, resourcing, and budgets before they cause real damage.
Without those analytics, changes fly under the radar. There’s no alert when you drift past your original scope, and no signal that the project is quietly expanding.
(It’s a common issue and a big problem, with projects experiencing 30% scope creep on average.)
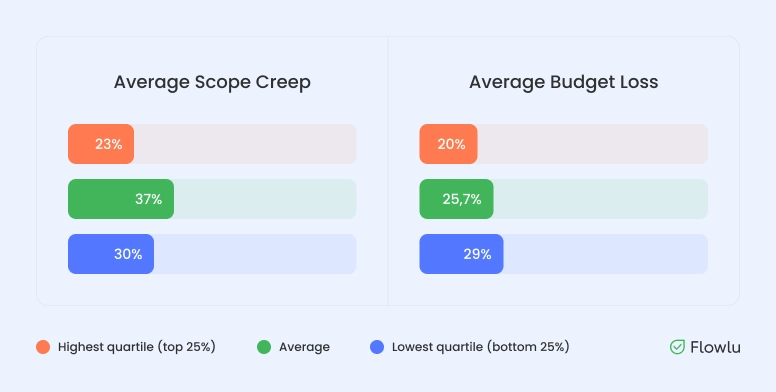
And when scope grows unchecked, costs almost always follow. On average, projects lose 25% of their budget due to this lack of visibility. But with project analytics in place, you’d see those shifts in real time.
This visibility makes it easier to push back, reset expectations, and formally re-scope.
Stakeholders Feel Confused
Without real-time insights into what’s happening right now — or the ability to connect past performance to what’s coming next — it’s hard to give stakeholders the clarity they expect.
At the start of a project, you’re guessing on timelines and budgets because there’s no structured data from past work to draw from.
And during delivery? Well, it’s just as messy.
You can’t easily show what’s happened, what’s happening, or where things are headed. This lack of visibility leads to vague updates, reactive decisions, and a lot of guesswork.
Stakeholders feel confused, lose confidence, and start questioning whether the project is truly under control. (The worst!)
Teams Burn Out
Without analytics on employee engagement levels, workload balance, or cycle time, it’s almost impossible to spot burnout or bottlenecks. This hurts both delivery and morale.
The potential domino effect? Increased turnover, lower performance, and delayed timelines.
Customer Outcomes Become a Guessing Game
Analytics also help you deliver the results your customers actually want.
But without visibility into customer feedback surveys, satisfaction scores, or engagement rates, it’s hard to know how your deliverables land.
With the right analytics in place, you can spot patterns in what customers value and where they expect more. But without clear insights, you’ll miss opportunities for improvement, resulting in declining loyalty over time.
What to Track and Why It Matters
Project management analytics are only powerful if you track the data that reflects what you’re trying to achieve.
The metrics below give teams clarity, drive project performance, and surface risks before they become roadblocks.
Timeline Health and Milestone Tracking
For a healthy project timeline, you need to consistently track whether your team is on pace to meet deadlines.
This involves monitoring key delivery milestones and verifying that tasks are completed on time. Doing this helps you spot delays early enough to fix them.
But if you don’t track timeline health, you won’t notice small slips. For example, a two-day delay in a task may push back the next. Before long, your project is way off track.
To keep projects on course, you need to monitor:
- Planned vs. Actual start and end dates
- Task duration and slippage trends
- Milestone completion status
- Timeliness of deliverables
These timeline metrics give you a clear picture of progress, help you set realistic expectations, and allow for pivoting before a deliverable drops.
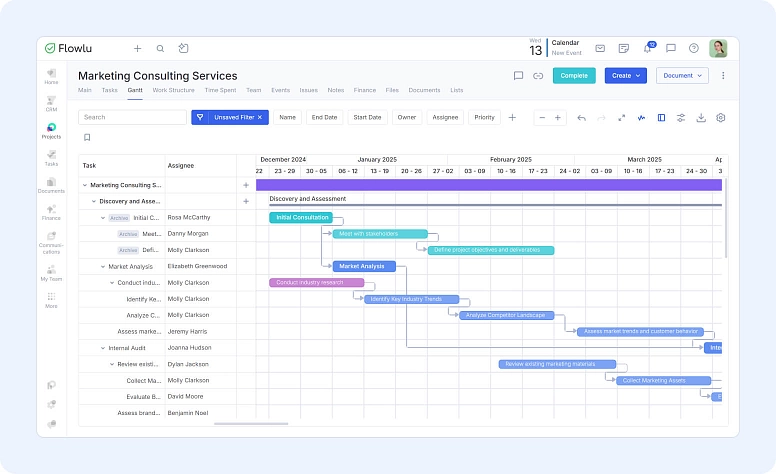
Flowlu makes all of this easy.
With drag-and-drop scheduling, live Gantt charts, and built-in alerts for overdue tasks. You can instantly see where things stand, while real-time updates highlight delays before they snowball.
Want a deeper dive into timelines? How to Create a Project Timeline: A Simple Step-by-Step Guide — it walks you through scope, dependencies, milestones, and resource planning step by step.
Scope Change and Request Metrics
Untracked scope changes silently kill projects. When teams accept extra work without capturing the impact, delivery starts to drift.
Scope management metrics show you the size of the overall project. These indicators help you budget your time and money around the actual scope of the project — not how easy you think the job is.
And when you track scope shifts consistently, you can spot changes that cause the project to grow. This way, you can assess risks, reassign resources as needed, and set healthy boundaries for staff so they’re flexible without overcommitting.
Monitor scope metrics, such as:
- Scope change approval rates
- Volume of change requests
- Time impact
Flowlu helps by tracking every change request through a structured review process. This real-time visibility lets you see the moment a change starts to impact your timeline or delivery.
It also shows you trends in how scope evolves so you can spot patterns in who or what causes scope creep.
Budget Performance and Financial Tracking
Like scope creep, budget overruns rarely happen all at once … they tend to leak out quietly.
That’s why it’s pivotal to track budget performance — so you can catch risks early and make sure funding aligns with actual progress.
With a good eye on project finances, you can better tie costs back to results, making it easier to defend every dollar to your stakeholders.
Be sure to track financial metrics like:
- Actual spend vs. forecasted budget
- Budget overruns by task or phase
- Spending pace over time
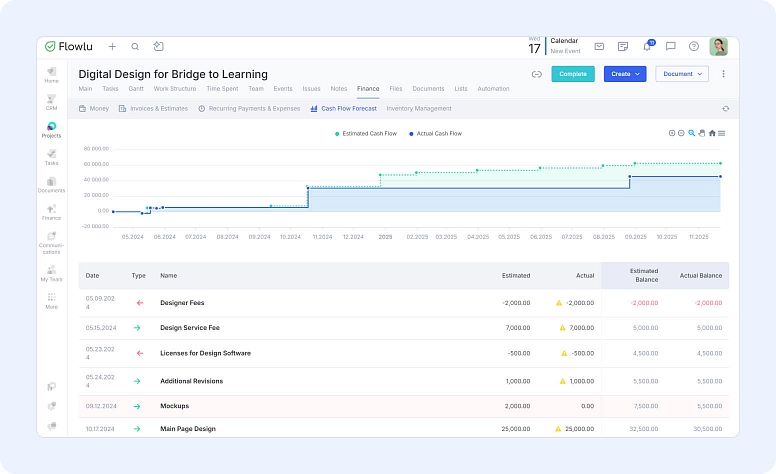
Flowlu’s budgeting tools give you full financial visibility at every phase.
They link spending to tasks, track budgets in real time, and highlight where costs are starting to drift.
And with fintech integrations, you can track every expense against goals automatically, whether it’s from a corporate credit card, a subcontractor invoice, or a software subscription.
This keeps your budget on target, while simplifying project closeout and saving hours in reconciliation.

Team Performance and Workload Distribution
If you don’t balance project workloads properly, even the most capable teams can fall behind.
To keep momentum strong, track team performance metrics like:
- Employee performance trends
- Task completion rates
- Individual workloads
- Team velocity
These project metrics reveal collaboration gaps, highlight burnout risks, and show where resources are over- or underutilized. With these insights, you can maintain positive team dynamics and improve delivery efficiency.
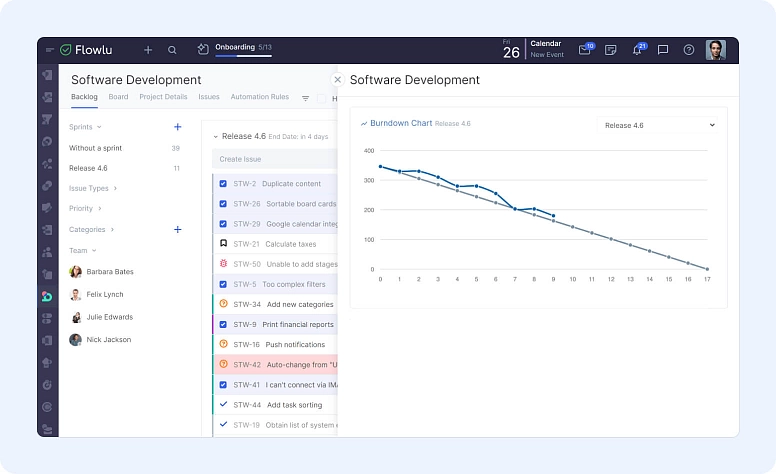
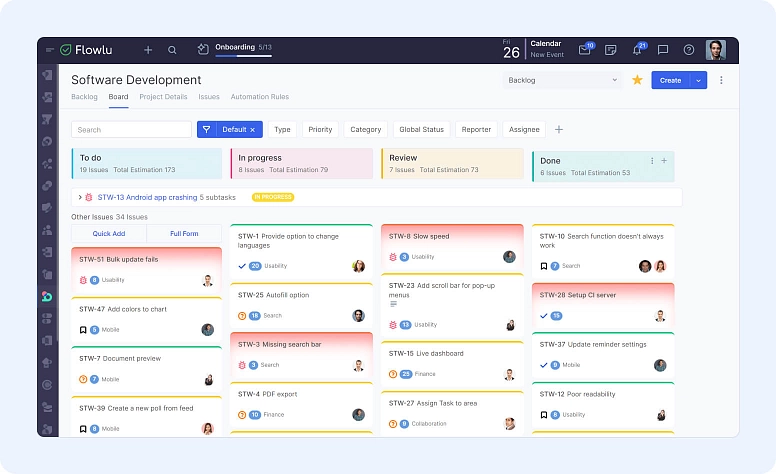
Flowlu’s performance tracking tools are ideal for measuring the pace of team initiatives and flagging resourcing issues early.
Whether you're analyzing cycle time or burndown metrics, you get the clarity to meet your deadlines without overloading the team.
Risk, Issue, and Blocker Tracking
Every project carries risks. But what separates successful teams is how quickly they identify and respond to them.
Analytics give you a live view of what’s going wrong, where issues are building up, and which parts of the project are most vulnerable. This guides you on where to take action before problems escalate.
And beyond immediate project fixes, risk-based analytics also support continuous learning.
If you can clearly see why past projects derailed, you’re far better equipped to avoid repeating mistakes.
For example, if cloud security breaches keep stalling delivery, that’s a clear sign to invest in better processes or tools like CSPM to bring security risks into the open.
Track risk-based metrics like:
- Number of open issues
- Time to resolution
- Progress on fixes
- Severity level
Flowlu’s risk and issue management module makes all of this visible so you don’t miss critical issues and risks that could completely upend your project.
Benefits Realization and Project Outcomes
Project success is as much about impact as it’s about delivering on time.
Tying impact to project outcomes helps you understand whether your efforts align with what customers actually value — and where you need to improve.
It also demonstrates your ability to deliver projects that meet the brief, making it easier to secure buy-in and funding for future initiatives.
To measure project outcomes and gain insights into customer feedback, track metrics like:
- Customer satisfaction ratings
- Return on investment (ROI)
- Net Promoter Scores (NPS)
- Customer retention rates
With Flowlu, you can define and measure outcome-based KPIs across every department. This helps you understand which tactics best drive outcomes — whether it’s marketing, customer service, product changes, or something else entirely.
5 Questions to Ask When Choosing Analytics Tools
The quality of your insights often depends on the analytics capabilities of your project management tools.
Here are five questions to ask when evaluating project management software to understand if it’ll show you what you need to know:
- Can it track timelines, budget, scope, and risks in one place? You lose time and clarity when you’re jumping between systems. Look for a tool that brings together a suite of project management capabilities and analytical insights.
- Does it give you real-time visibility to make timely decisions? It’s not enough to see what happened after the fact. You need a tool that updates as work progresses so you can spot delays, scope changes, or budget shifts as they happen and adjust before they spiral.
- Can it handle both structured and unstructured data? From sales data to customer feedback, your metrics come in many forms. Choose software that supports both types so you can connect everything from task completion to customer satisfaction scores.
- Does it integrate with your other key systems? Your analytics tool should connect with the platforms where your workflows already live. This helps you track everything seamlessly, without having to overhaul your whole system.
- Does it help you understand team dynamics, not just task output? Don’t simply measure project outputs. You need to make sure your team can cope. Look for tools that surface performance trends, highlight engagement patterns, and analyze employee surveys. These insights play a critical role in understanding how to improve the way your team works together.
In short, you don’t want an analytics tool that does nothing but report data.
You need analytics software that helps you streamline your projects by flagging trends and issues, and giving you insights to shape improvements.
Wrap Up
Without strong project analytics, you’re just guessing.
You can’t see problems early. You don’t know why things don’t go as planned. And you can’t improve your workflows for better outcomes next time.
But by tracking the right project metrics, you can align your goals with your outcomes in real time.
You can unlock smarter decisions, deliver better results, and increase your overall project impact — without overburdening your teams.
Powerful analytics turn structured data into direction. And direction into success.
If you’re ready to stop chasing spreadsheets and start building momentum, Flowlu gives you the clarity and tools to lead with confidence.

The basics you don’t want to skip are timelines, budget, scope changes, team workload, and risks. These give you a clear picture of where the project stands and where trouble might pop up.
Manual reports show you what already happened. Real-time analytics show you what’s happening now and what’s about to happen. That difference helps you step in early before delays or scope creep get out of hand.
With the right analytics, you can see if workloads are uneven, spot burnout before it hits, and check if tasks are moving at the right pace. This keeps the team healthier and projects moving smoothly.