


PERT in Project Management: Method, Meaning, and Analysis


Analytics provide employees with strong data. This firm foundation helps transform uncertainty into a more structured framework and deliver complex initiatives successfully. In our review we talk about how PERT distinguishes itself from other methods and why you should try it in your company.
What is the PERT method in project management?
Before we show you how this works, it’s important to understand the PERT meaning in project management.
PERT definition in project management
The full form of PERT is Program Evaluation and Review Technique.
You can define pert in project management as a statistical method that analyzes tasks and timelines.
It’s a visual diagram that shows activities, their timing, and dependencies to help managers identify potential bottlenecks or obstacles.
This planning tool can be used to determine exactly how long a specific step really takes.
This way, you can see this diagram as a way to make team coordination and schedule deliverables easier.
When combined with digital tools such as Flowlu, these benefits are further amplified through automation and real-time visibility.

Background and characteristics
One interesting fact that you may not know about is that this model was created by the US Navy back in the 50s. The purpose was to manage the Polaris submarine program. This specific initiative required not only different contractors but also dealing with many research timelines that were quite unpredictable. However, the private sector didn’t stay quiet. They developed the critical path around the same time.
As we’ve mentioned in the beginning of this article, there are various tools or approaches you can take on when it comes to scheduling.
Here are 4 aspects that make the PERT distinguished:
#1. Statistical
That means the analytics uses formulas to turn the estimates into more realistic timelines. We will refer to this below with more detail.
#2. Dependencies
This method allows you to easily determine and see what needs to be done so others can start.
#3. More than one time estimate
It provides more than just one time estimate per stage. You’ll most likely have one optimistic and one pessimistic approach, as we will also see below in more detail.
#4. Critical path (CP)
With the use of a critical path, specialists can determine the sequence of operations that reveals the shortest possible completion time for the entire process.
How PERT works in project management
PERT in project management can be divided into 3 main parts that work together:
Events and activities
These elements are the base of the diagram. While an event is seen as a milestone that you reach in the moment when something is complete, an activity is the work that allows the event to be reached.
Imagine that you have a marketing campaign. In this case, the event here is the launch of the campaign. The activity—everything that helps achieve it: creating ads and promotional content and even preparing the strategy for the launch.
Time estimates
You’ll get 3 different time estimates to make sure that you know all the possible outcomes:
- Optimistic (O): This metric assumes that everything is ideal (approvals are almost immediate, all resources are always available, no rework is needed, just to mention a few). Therefore, everything will be done within the shortest possible duration. As you can imagine, this is an extremely rare situation.
- Most Likely (M): This is the more realistic projection, as it is the one that is more frequent. It includes dealing with standard revision cycles, common delays, resource constraints, among others.
- Pessimistic (P): This scenario takes into consideration the worst possible conditions. Notice that we’re not talking about catastrophes but significant problems that may include sick leaves, several revision rounds, vendor delays, among others. This is also a rare situation.
The task duration (TD) can then be calculated using the following formula:
TD = (O + 4M + P) / 6
Dependencies and critical path
As we’ve already said above, dependencies refer to the activities that need to be completed before others can start. In what refers to the CP, it can be defined as the longest chain of dependent activities.
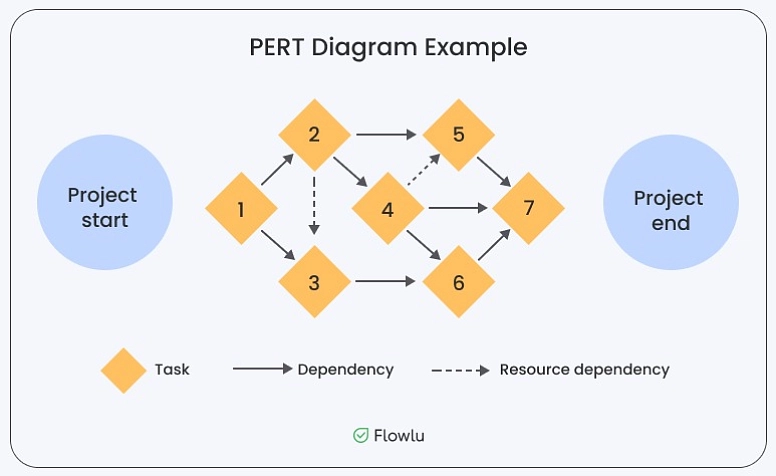
PERT analysis in project management
It’s a visual or network diagram that shows not only activities but also their dependencies.
There are 3 key components inside:
- Nodes: can be represented by either circles or rectangles and refer to the events.
- Arrows: show the steps that need to be finished.
- Direction: displays not only the direction but also the dependency.
Activities
It’s important to keep in mind that every activity in a diagram includes 3 different aspects:
- Predecessors: these are the steps that need to be completed first.
- Duration: or the expected time.
- Float: also referred to as slack, which is the delay that is allowed.
In addition, there are two different types of activities:
- Critical. It can’t be delayed and, therefore, has zero slack.
- Non-critical. Activities that have more flexibility.
PERT vs critical path method (CPM)
While both methodologies help managers map a project structure, their purposes are substantially different.
Choosing the right method depends not only on your planning needs but also on the level of predictability involved.
1—PERT; 2—CPM
#1. Time estimates
| 1 | 2 |
| Three: optimistic, pessimistic, and most likely time. | Only one. |
#2. Focus
| 1 | 2 |
| Used when dealing with uncertainty. | Preferred when you need to optimize completion speed and cost. |
#3. Best uses
| 1 | 2 |
|
Works best for one-off or uncertain initiative. Example: marketing campaigns, research, and product development. |
Handling predictable or everyday work. Example: event planning, manufacturing processes, or routine maintenance. |
#4. Complexity calculations
| 1 | 2 |
| Uses more advanced formulas (it is a statistical method). | Build on simple additions. |
Step‑by‑step example of PERT for a project
When you decide that you will use this tool, you will need to transform it into a structured plan. This allows you to draw the diagram.
Here are the steps you need to follow:
Step #1: Identify project activities
The first thing you’ll need to do is to determine all the activities that will need to be done.
When you have a large undertaking, you’ll need to break it into smaller, measurable steps. However, you want to make sure that you don’t go too far with this. Try to focus on the tasks that take days and weeks, not only hours.
Also in this step, you will need to add a deliverable and assign someone responsible to each activity.
Step #2: Set the dependencies
Now, determine the stage that needs to be finished so others can start.
Notice that this may be a bit more challenging since you may have:
- two different actions that start simultaneously,
- tasks that need to end at the same time,
- even operations that can’t end until another one starts.
Mapping dependencies on paper gets messy fast. Project planning software with task dependencies and Gantt charts lets you visualize the same relationships digitally and adjust them as the plan evolves.
Step #3: Activity duration estimates
The best thing you can do is to go directly to the course. This means asking the people who usually complete them about the time they take.
However, when the initiative is new or you’re stuck for any reason, you need to think about the 3 different estimates to determine the length (optimistic, most likely, and pessimistic).
Step #4: Create the PERT diagram
You’re ready to build your diagram.
You should start by drawing your activities as a flowchart with a circle or rectangle around them.
Then, add the arrows to show the dependencies. The diagram should be read from left to right.
Step #5: Determine critical path and slack
Just look at the diagram you created and identify the longest sequence of dependent activities, which shows the CP for the process.
You should then calculate the slack or float for non-critical processes.
Keep in mind that the tasks with zero slack are the ones that are already on the CP, and these are the ones you should pay more attention to.
Step #6: Review and validate the chart
As soon as you prepare the chart, you should show it to both team members and stakeholders.
This is important because they may notice incorrect dependencies, unrealistic estimations, or any missing details.
Step #7: Keep monitoring & updating
While you may believe that you’re done as soon as the chart is drawn. The truth is that things are always changing and need to be quickly adapted. And the Program Evaluation and Review Technique chart is one of those things.
Imagine that an operation takes longer than you anticipated. You need to take this delay into account in the diagram as well as take notice of it for future deadlines.
Advantages of PERT method in project management
- Streamlined planning through the identification of patterns
- Improved scheduling
- Better estimation of task durations
- Accurate dependencies
- Identifying critical path
- Resource and time optimization
- Easily identifiable bottlenecks
- Optimization of the allocation of equipment, materials, and personnel
- Allows to know the expected completion time, the probability of completing before the deadline, the task that has a slack time, and each activity's start and end dates.
Limitations and disadvantages of PERT
- It may require more effort
- May be very time-consuming
- Getting accurate data might be difficult
- Determining how long the completion will take may be challenging and lead to inaccuracies.
- It may be complicated because it is usually a static analysis; therefore, it is difficult to add immediate changes
- Its accuracy is dependent on the accuracy of task duration estimates.
From all these disadvantages and limitations, you can certainly understand that this model may not be the best for an Agile approach that requires constant monitoring and adaptation as the process evolves.
Upgrade your PERT analysis in project management
There’s no question that this analysis is a very powerful tool for managers. It delivers incredible insights into what concerns not only planning but also risks and resource allocation.
While there are other tools that can help, the PERT is a great option for more demanding and uncertain undertakings.
Analytical potential increases when you automate processes. Try implementing a specialized project management platform.
Flowlu is one of these. It allows you to automate routine processes, track tasks, and study results. For example, you can track time spent versus estimated time, gather statistics, and create a personalized dashboard with widgets to see how projects are progressing in real time: active revenue, cost, or profitability overview.
Use proven methods with reliable tools to obtain the best statistics.

FAQ
While its accuracy depends on the historical data and quality of your inputs, it is certainly one of the best tools employees can use for complex ideas that have a huge uncertainty.
It depends. In case the work involves research, innovation, or doing something new, the described methodology should be used.
On the other hand, if the initiative is similar to previous ones, includes routine work, and is well-defined, you should go with the CPM.
Yes, you can, especially if there are many dependencies.
While Gantt charts present the plan on a timeline using horizontal bars to indicate when each task starts and ends, the chart highlights dependencies between steps along the timeline.
It is drawn using rectangles or circles with each stage and arrows pointing in the right direction, also displaying the expected time for the completion.